. 1998 Mar;116(3):1013-21.
doi: 10.1104/pp.116.3.1013.

Xyloglucan octasaccharide XXLGol derived from the seeds of hymenaea courbaril acts as a signaling molecule

Xyloglucan octasaccharide XXLGol derived from the seeds of hymenaea courbaril acts as a signaling molecule

C Vargas-Rechia et al. Plant Physiol. 1998 Mar.

Abstract

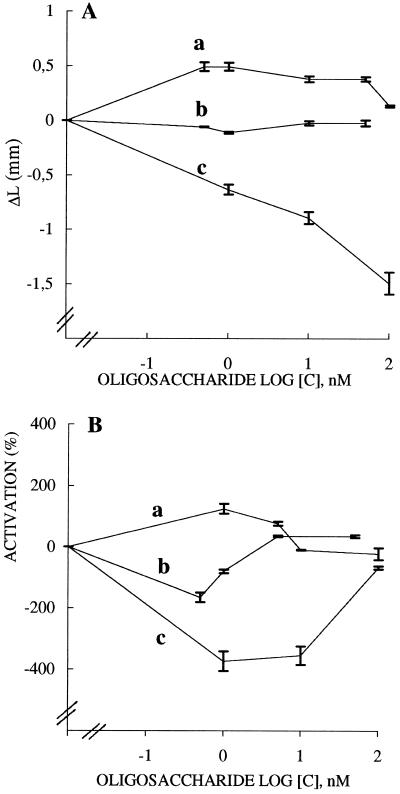
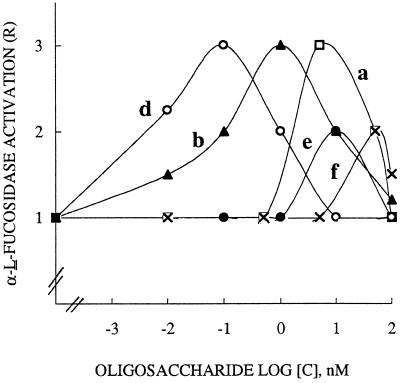
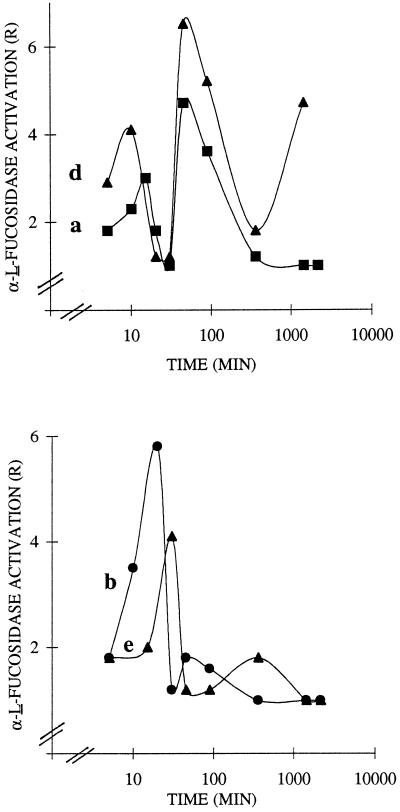
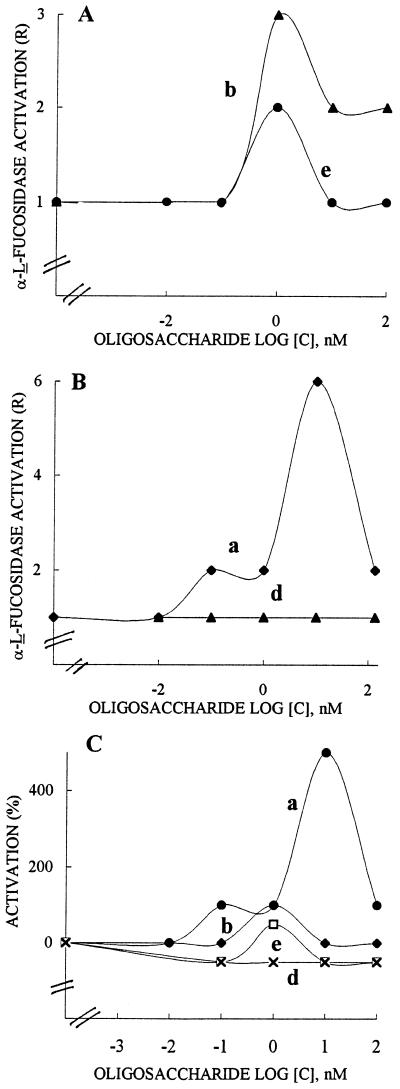
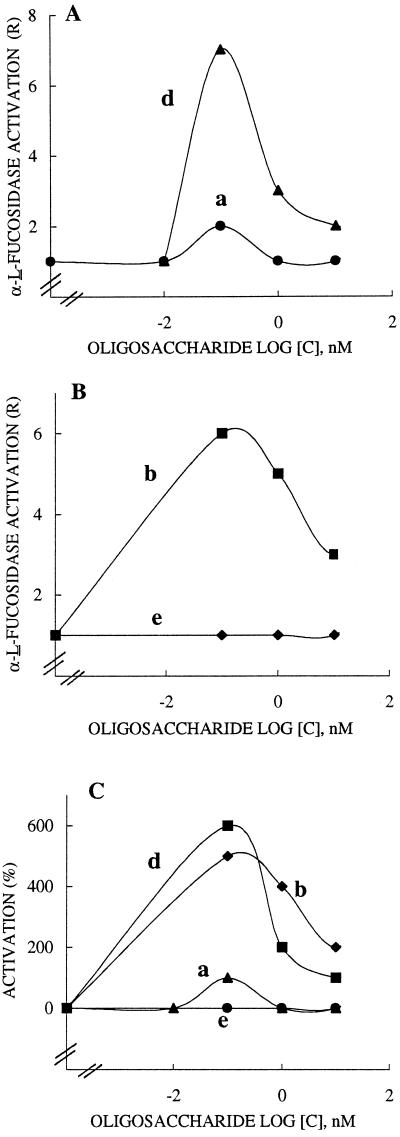
Treatment of the xyloglucan isolated from the seeds of Hymenaea courbaril with Humicola insolens endo-1,4-beta-d-glucanase I produced xyloglucan oligosaccharides, which were then isolated and characterized. The two most abundant compounds were the heptasaccharide (XXXG) and the octasaccharide (XXLG), which were examined by reference to the biological activity of other structurally related xyloglucan compounds. The reduced oligomer (XXLGol) was shown to promote growth of wheat (Triticum aestivum) coleoptiles independently of the presence of 2, 4-dichlorophenoxyacetic acid (2,4-D). In the presence of 2,4-D, XXLGol at nanomolar concentrations increased the auxin-induced response. It was found that XXLGol is a signaling molecule, since it has the ability to induce, at nanomolar concentrations, a rapid increase in an alpha-l-fucosidase response in suspended cells or protoplasts of Rubus fruticosus L. and to modulate 2,4-D or gibberellic acid-induced alpha-l-fucosidase.


Figures

Figure 1
Figure 1
Effect of the xyloglucan oligomers XXLGol (a) and XXFGol (b) and of 2′-fucosyl-lactose (c) on the straight growth of wheat coleoptiles (A) and on the elongation promoted by 2,4-D (B). Two independent experiments, each conducted from 15 to 20 coleoptile segments treated or not with 2,4-D (1 μm) for 62 h were monitored and the mean increments of length (ΔL) were plotted. In A each value of a curve is the average of 30 to 40 experiments, and vertical bars represent ses. Data are presented as ΔL versus log sugar concentration; ΔL is the additional increase in length between 10 and 20 h. The absolute increase in length of controls (sets in the absence of 2,4-D or oligosaccharides) exhibited the mean value of 3.87 mm. This value was the reference (ΔL = 0). In B data are presented as mean percentages of inhibition or activation of 2,4-D-stimulated growth, calculated as percentages of activation or inhibition = L(2,4-D + oligosaccharide) − (L[2,4-D])/(L[2,4-D]) − L(control) × 100%, where L(2,4-D) is the mean final length of segments treated with 2,4-D, L(control) is the mean final length of segments incubated without 2,4-D, and L(2,4-D + oligosaccharide) is the mean final length of segments treated with 2,4-D plus the oligosaccharide. Plotted data represent the means ± se.
Figure 2
Figure 2
Dose-response curves for α-l-fucosidase response induced by the xyloglucan oligomers XXLGoL (a), XXFGol (b), and XXXGol (d), the trisaccharide methyl α-l-Fuc-(1→2)-β-d-Gal(1→2)-β-d-Xyl (e), and the polymer (f). R. fruticosus protoplasts (2 × 10⁶) in 25 mL of buffer were incubated for 15 min in the presence of inducer up to 100 nm. Each curve was obtained by least-squares regression of data from three to four replications carried out from three independent inducer sets. R is reported as the rate of α-l-fucosidase activity of treated over control protoplasts.
Figure 3
Figure 3
Time course for α-l-fucosidase activation in R. fruticosus protoplasts challenged with the sugar inducers XXLGol (a), XXFGol (b), and XXXGol (d) and the trisaccharide methyl α-1-Fuc-(1→2)-β-d-Gal-(1→2)-β-d-Xyl (e). Protoplasts (2 × 10⁶) in 25 mL of buffer were challenged with inducer used at the optimal concentration (0.1 nm XXXGol, 1 nm XXFGol, 5 nm XXLGol, and 10 nm trisaccharide). Each curve was obtained by least-squares regression of data from three to four replications carried out from three independent inducer sets. R is reported as the rate of α-l-fucosidase activity of treated over control protoplasts. Control sets were run without addition of 2,4-D or oligosaccharides.
Figure 4
Figure 4
Effects of XXLGol (a), XXFGol (b), and XXXGol (d) and the trisaccharide methyl α-l-Fuc(1→2)-β-d-Gal(1→2)-β-d-Xyl (e) on 2,4-D-stimulated α-l-fucosidase in R. fruticosus protoplasts. The results are expressed as the R value in A and B and as the mean percentage of activation (inhibition) of 2,4-D-stimulated response in C. Protoplasts (2 × 10⁶) in 25 mL of buffer were incubated for 15 min with sugar inducer up to 100 nm in the presence of 10 nm 2,4-D. Each curve was obtained by least-squares regression of data from three to four replications carried out from three independent inducer sets. The induced response given as R is reported as the rate of α-l-fucosidase activity of treated protoplasts over controls. The mean percentage of activation (inhibition) is calculated as R(2,4-D + oligosaccharide) − (R[2,4-D])/(R[2,4-D]) − R(control) × 100, where R(2,4-D + oligosaccharide) and R(2,4-D) are R values in protoplasts incubated with sugar inducer and 2,4-D and with 2,4-D, respectively, and R(control) is the R value in protoplasts suspended in buffer without the addition of 2,4-D or oligosaccharides.
Figure 5
Figure 5
Effects of XXLGol (a), XXFGol (b), XXXGol (d) and the trisaccharide methyl α-l-Fuc-(1→2)-β-d-Gal-(1→2)-β-d-Xyl (e) on GA3-stimulated α-l-fucosidase in R. fruticosus protoplasts. The results are expressed as the R value in A and B and as the mean percentage of activation of GA3-stimulated response in C. Protoplasts (2 × 10⁶) in 25 mL of buffer were incubated for 15 min with sugar up to 100 nm in the presence of 10 nm GA3. Each curve was obtained by least-squares regression of data from three to four replications carried out from three independent inducer sets. R is reported as the rate of α-1-fucosidase activity of treated protoplasts over controls. The mean percentage of activation is calculated as = R(GA3 + oligosaccharide) − (R[GA3])/(R[GA3]) − R(control) × 100, where R(GA3 + oligosaccharide) and R(GA3) are R values in protoplasts incubated with sugar and GA3 and with GA3, respectively, and R(control) is the R value in protoplasts suspended in buffer without the addition of 2,4-D or oligosaccharides.

References

    1. Aldington S, Fry SC. Oligosaccharins. Adv Bot Res. 1993;19:1–107.
    1. Armand S, Drouillard S, Schülein M, Henrissat B, Driguez H. A bifunctionalized fluorogenic tetrasaccharide as a substrate to study cellulases. J Biol. 1997;272:2709–2713. - PubMed
    1. Augur C, Stiefeld V, Darvill AG, Albersheim P, Puigdomenech P. Molecular cloning and pattern of expression of an α-l-fucosidase gene from pea seedlings. J Biol Chem. 1995;270:24839–24843. - PubMed
    1. Augur C, Yu I, Sakai K, Ogawa T, Sinay P, Darvill AG, Albersheim P. Further studies of the ability of xyloglucan oligosaccharides to inhibition auxin-stimulated growth. Plant Physiol. 1992;99:180–185. - PMC - PubMed
    1. Braccini I, Hervé du Penhoat C, Michon V, Goldberg R, Clochard M, Jarvis MC, Huang Z-H, Gage DA. Structural analysis of cyclamen seed xyloglucan oligosaccharides using cellulase digestion and spectroscopic methods. Carbohydr Res. 1995;276:167–181. - PubMed

LinkOut - more resources