

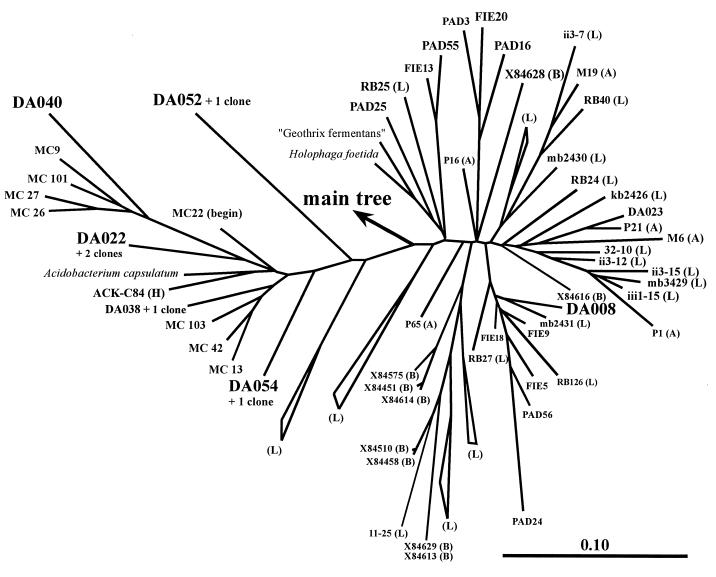
Phylogeny of the main bacterial 16S rRNA sequences in Drentse A grassland soils (The Netherlands)
- PMID: 9501427
- PMCID: PMC106340
- DOI: 10.1128/AEM.64.3.871-879.1998
Phylogeny of the main bacterial 16S rRNA sequences in Drentse A grassland soils (The Netherlands)
Abstract
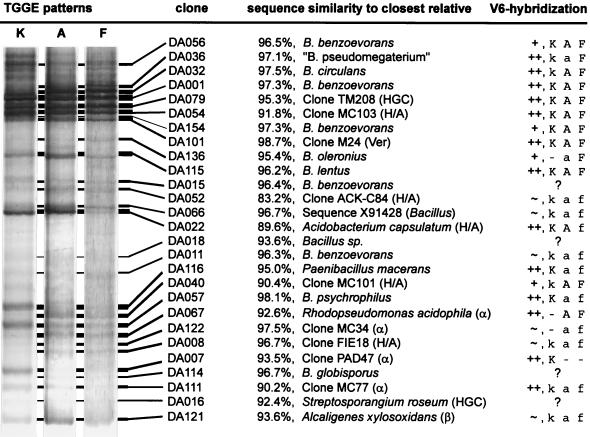
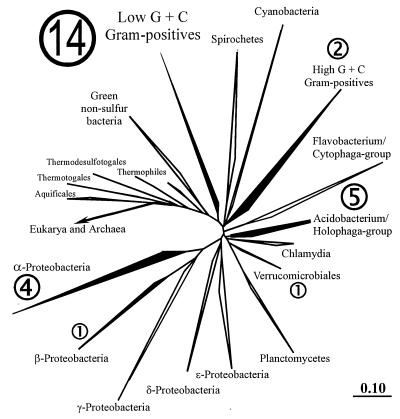
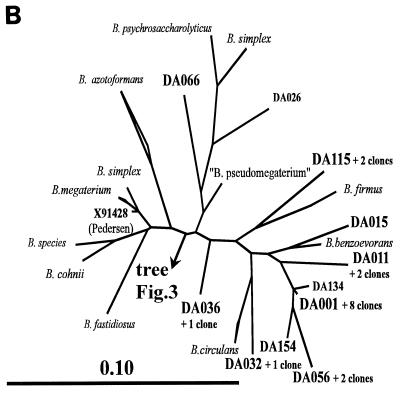
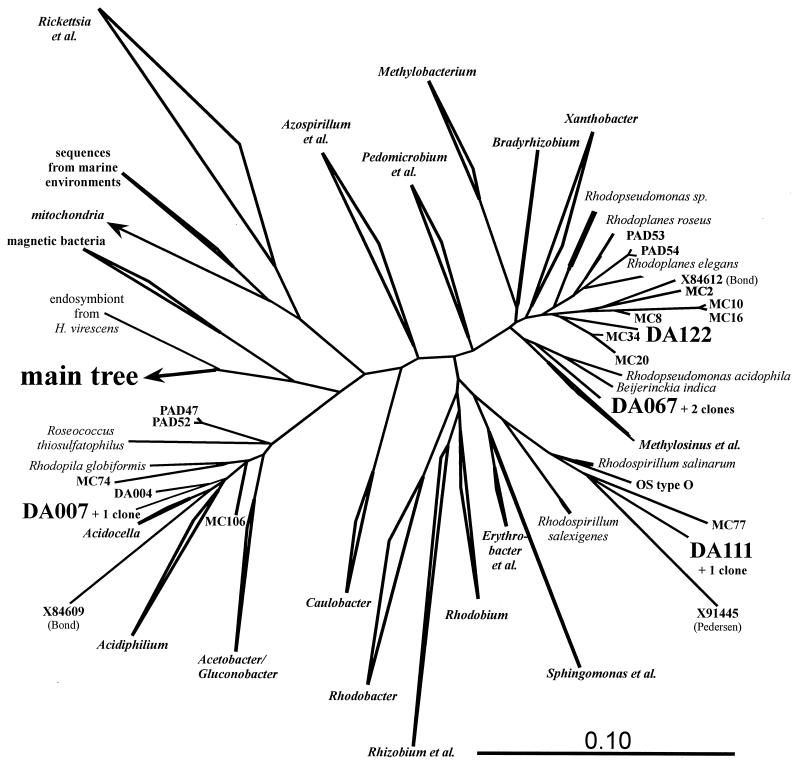
The main bacteria in peaty, acid grassland soils in the Netherlands were investigated by ribosome isolation, temperature gradient gel electrophoresis, hybridization, cloning, and sequencing. Instead of using only 16S rDNA to determine the sequences present, we focused on rRNA to classify and quantify the most active bacteria. After direct ribosome isolation from soil, a partial amplicon of bacterial 16S rRNA was generated by reverse transcription-PCR. The sequence-specific separation by temperature gradient gel electrophoresis yielded soil-specific fingerprints, which were compared to signals from a clone library of genes coding for 16S rRNA. Cloned 16S rDNA sequences matching with intense bands in the fingerprint were sequenced. The relationships of the sequences to those of cultured organisms of known phylogeny were determined. Most of the amplicons originated from organisms closely related to Bacillus species. Such sequences were also detected by direct dot blot hybridization on soil rRNA: a probe specific for Firmicutes with low G+C content counted for about 50% of all bacterial rRNA. The bacterial activity in Drentse A grassland soil could be estimated by direct dot blot hybridization and sequencing of clones; it was found that about 65% of all the bacterial ribosomes originated from Firmicutes. The most active bacteria apparently were Bacillus species, from which about half of the sequences derived. Other sequences similar to those of gram-positive bacteria were only remotely related to known Firmicutes with a high G+C content. Other sequences were related to Proteobacteria, mainly the alpha subclass.
Figures

References
-
- Bakken L R, Olsen R A. The relationship between cell size and viability of soil bacteria. Microb Ecol. 1987;13:103–114. - PubMed
Publication types
MeSH terms
Substances
Associated data
- Actions
- Actions
- Actions
- Actions
- Actions
- Actions
- Actions
- Actions
- Actions
- Actions
- Actions
- Actions
- Actions
- Actions
- Actions
- Actions
- Actions
- Actions
- Actions
- Actions
- Actions
- Actions
- Actions
- Actions
- Actions
- Actions
- Actions
- Actions
- Actions
- Actions
LinkOut - more resources
Full Text Sources
Other Literature Sources
Molecular Biology Databases
