. 1998 Mar;64(3):1006-12.
doi: 10.1128/AEM.64.3.1006-1012.1998.

Development and testing of a bacterial biosensor for toluene-based environmental contaminants

Affiliations

Development and testing of a bacterial biosensor for toluene-based environmental contaminants

B M Willardson et al. Appl Environ Microbiol. 1998 Mar.

Abstract

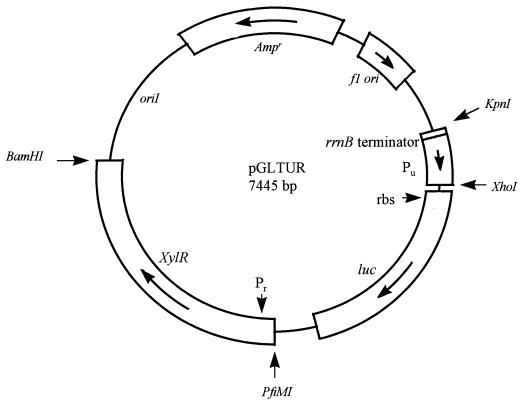
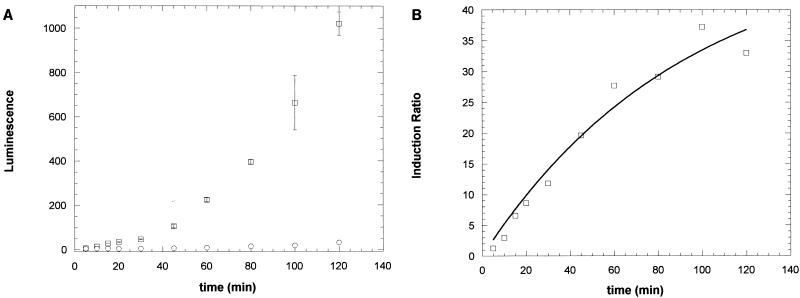
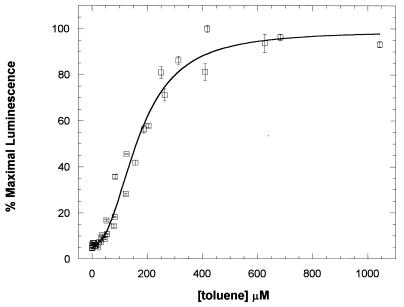
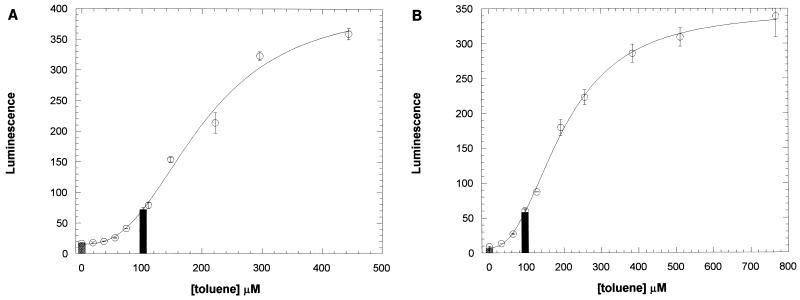
A bacterial biosensor for benzene, toluene, and similar compounds has been constructed, characterized, and field tested on contaminated water and soil. The biosensor is based on a plasmid incorporating the transcriptional activator xylR from the TOL plasmid of Pseudomonas putida mt-2. The XylR protein binds a subset of toluene-like compounds and activates transcription at its promoter, Pu. A reporter plasmid was constructed by placing the luc gene for firefly luciferase under the control of XylR and Pu. When Escherichia coli cells were transformed with this plasmid vector, luminescence from the cells was induced in the presence of benzene, toluene, xylenes, and similar molecules. Accurate concentration dependencies of luminescence were obtained and exhibited K1/2 values ranging from 39.0 +/- 3.8 microM for 3-xylene to 2,690 +/- 160 microM for 3-methylbenzylalcohol (means +/- standard deviations). The luminescence response was specific for only toluene-like molecules that bind to and activate XylR. The biosensor cells were field tested on deep aquifer water, for which contaminant levels were known, and were able to accurately detect toluene derivative contamination in this water. The biosensor cells were also shown to detect BETX (benzene, toluene, and xylene) contamination in soil samples. These results demonstrate the capability of such a bacterial biosensor to accurately measure environmental contaminants and suggest a potential for its inexpensive application in field-ready assays.


Figures

FIG. 1
FIG. 1
Plasmid map of the pGLTUR biosensor construct. Important features of the toluene biosensor are indicated, including the location and orientation of the Pu promoter, the E. coli rrnB transcription terminator sequence, the luc luciferase gene, the Pr promoter, and the xylR transcriptional activator gene. Restriction sites used to insert Pu and xylR are shown for reference. rbs, ribosome binding site.
FIG. 2
FIG. 2
Kinetics of induction of the toluene biosensor by 3-xylene. (A) Rate of luminescence increase (arbitrary luminescence units) in DH5α cells harboring the toluene biosensor plasmid in nonexposed cells (○) or after exposure to 250 μM 3-xylene (□). Luminescence was measured as described in Materials and Methods. Error bars represent the standard deviations from three replicates of each time point. The rate of cell growth was the same for 3-xylene-exposed and control cell suspensions (data not shown). (B) Kinetics of the ratio of luminescence from 3-xylene-exposed and -unexposed cells in panel A. The line represents the nonlinear least-squares fit of the data to the first-order rate equation y = ymax (1 − e−kt), in which y is the ratio of luminescence from 3-xylene-exposed versus -unexposed cells at time t, ymax is the maximal value of the induction ratio at infinite time, and k is the rate constant. A ymax value of 50.5 ± 10.0 and a k value of 0.011 ± 0.003 min−1 were obtained from the curve fit.
FIG. 3
FIG. 3
The toluene concentration dependence of luminescence from toluene biosensor cells. Luminescence from DH5α cells harboring the pGLTUR plasmid was measured at the concentrations of toluene indicated, as described in Materials and Methods. Data from three separate experiments were normalized for maximal luminescence and combined. The error bars represent the standard deviations of three replicates of each sample within the same experiment. The line represents the nonlinear least-squares fit of the data to the Hill equation, y = {(ymaxymin)[toluene]n/(K1/2n + [toluene]n)} + ymin, in which y is the percentage of maximal luminescence at a given concentration of toluene, ymax is the percentage of maximal luminescence at the saturating concentration of toluene (100%), and ymin is the percentage of maximal luminescence at a toluene concentration of zero. K1/2 is the concentration of toluene at which half-maximal effect is observed, and n is the Hill coefficient, napp. Values of 169 ± 9.6 μM for K1/2 and 2.3 ± 0.3 for napp were obtained from the curve fit.
FIG. 4
FIG. 4
Testing of contaminated water and soil by using the toluene biosensor. (A) Water from BETX-contaminated well OS-13 and from uncontaminated well USTB-2 at the Baca Street site in Santa Fe, N. Mex., was tested for toluene derivative contamination as described in Materials and Methods. The luminescence responses to water from the contaminated well (black bar) and the uncontaminated well (cross-hatched bar) are shown, as is the luminescence response to different known toluene concentrations (○). Error bars represent the standard deviations of three replicates of each sample. The standard curve was fit to the Hill equation as described for Fig. 3 (represented by the line), and the resulting equation was used to calculate the toluene equivalent concentrations of the well water (indicated by the positions of the bars on the x axis). (B) Soil from the DP road site at Los Alamos, N. Mex., was extracted with ethanol and tested for toluene derivative contamination as described in Materials and Methods. The luminescence responses of ethyl alcohol extracts from contaminated (black bar) and uncontaminated (cross-hatched bar) soil collected from the same site are shown, as is the luminescence response to different known toluene concentrations (○). Error bars represent the standard deviations of three replicates of each sample. The toluene equivalent concentrations were determined as for panel A.

References

    1. Abril M-A, Michan C, Timmis K N, Ramos J L. Regulator and enzyme specificities of the TOL plasmid-encoded upper pathway for degradation of aromatic hydrocarbons and expansion of the substrate range of the pathway. J Bacteriol. 1989;171:6782–6790. - PMC - PubMed
    1. Abril M-A, Buck M, Ramos J L. Activation of the Pseudomonas TOL plasmid upper pathway operon. J Biol Chem. 1991;266:15832–15838. - PubMed
    1. Assinder S J, Williams P A. The TOL plasmids: determinants of the catabolism of toluene and the xylenes. Adv Microb Physiol. 1990;31:1–69. - PubMed
    1. Burlage R S, Hooper S W, Sayler G S. The TOL (pWWO) catabolic plasmid. Appl Environ Microbiol. 1989;55:1323–1328. - PMC - PubMed
    1. de Lorenzo V, Fernandez S, Herrero M, Jakubzik U, Timmis K N. Engineering of alkyl- and haloaromatic-responsive gene expression with mini-transposons containing regulated promoters of biodegradative pathways of Pseudomonas. Gene. 1993;130:41–46. - PubMed

Publication types

MeSH terms

LinkOut - more resources