. 1998 Apr 1;18(7):2399-411.
doi: 10.1523/JNEUROSCI.18-07-02399.1998.

Reduction of O-linked N-acetylglucosamine-modified assembly protein-3 in Alzheimer's disease

Affiliations

Reduction of O-linked N-acetylglucosamine-modified assembly protein-3 in Alzheimer's disease

P J Yao et al. J Neurosci. .

Abstract

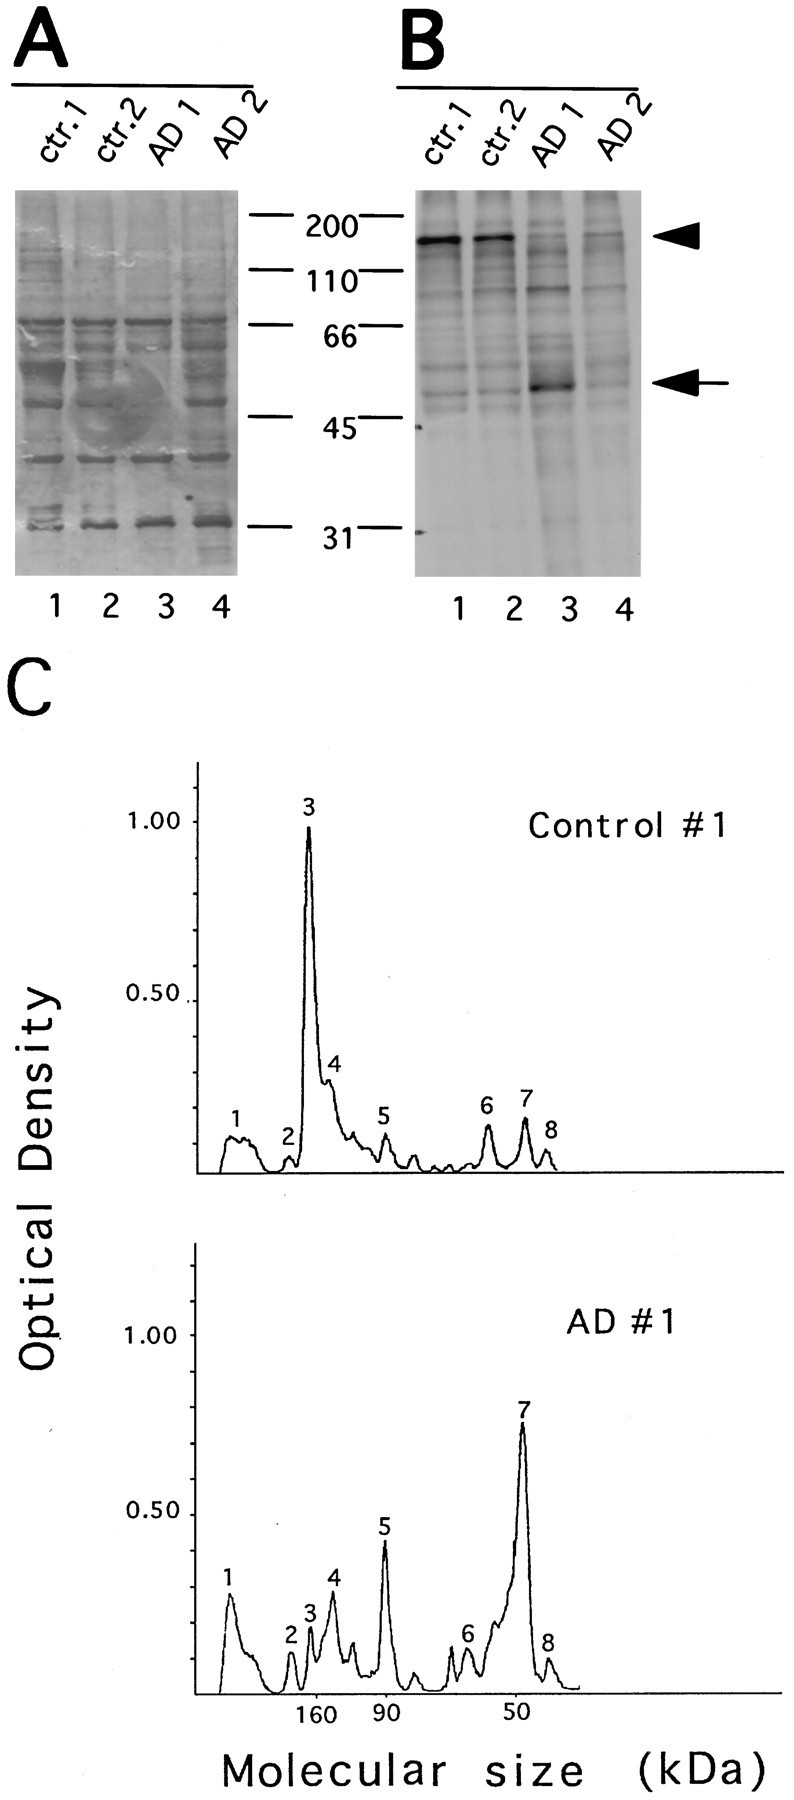
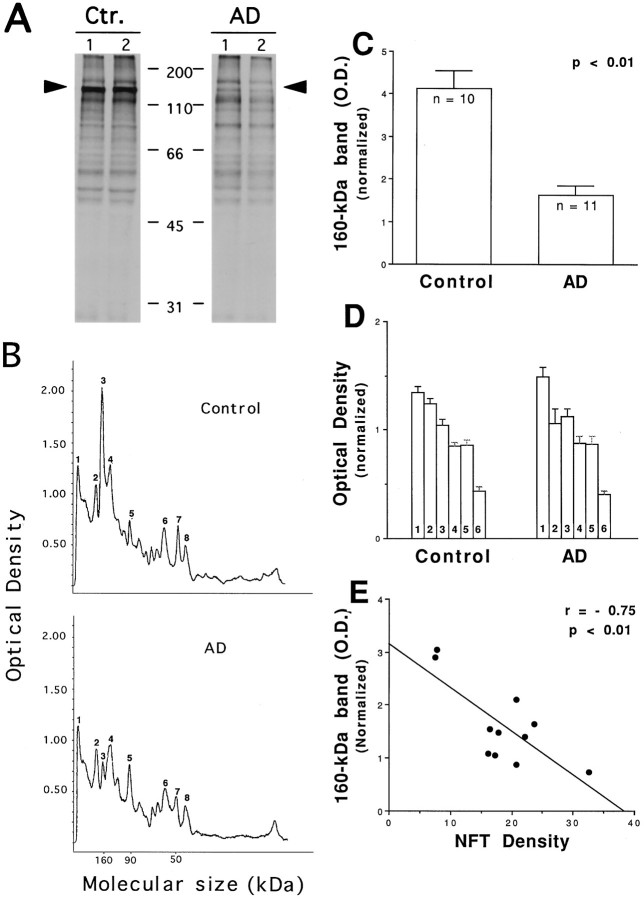
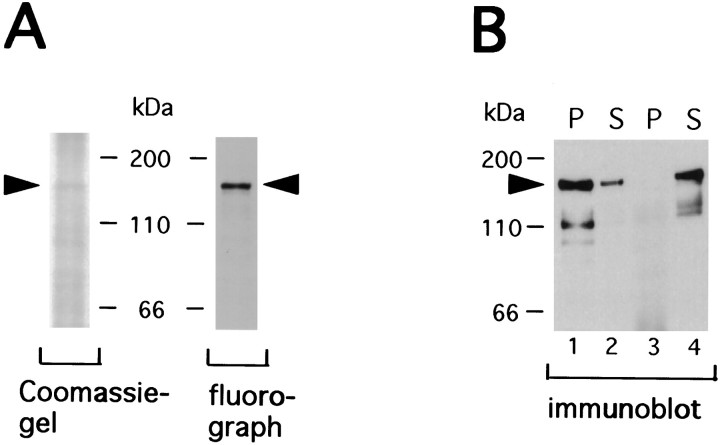
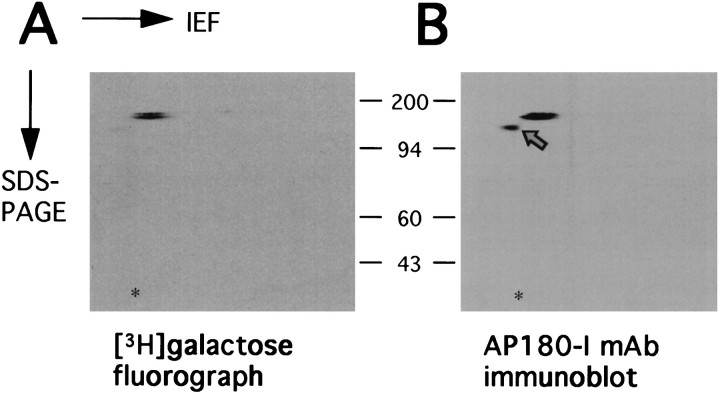
Abnormal protein processing and modification is associated with Alzheimer's disease (AD) pathology. The role of phosphorylation in AD has been studied extensively because the presumed abnormal phosphorylation of tau protein is believed to play a role in the formation of paired helical filaments. Glycosylation with O-linked N-acetylglucosamine (O-GlcNAc) to serine and threonine residues is a dynamic protein modification of intracellular proteins, and it shares similar features with protein phosphorylation. In this study, O-GlcNAc glycosylation of proteins from autopsied human brains with confirmed AD and non-AD age-matched controls was examined. O-GlcNAcylation was demonstrated by labeling protein extracts with [3H]galactose in the presence of galactosyltransferase and subsequent analyses of saccharide-protein linkage and saccharide structure. The number of O-GlcNAc-containing proteins and the overall O-GlcNAc level do not appear to be different between AD and control brain tissues. The only significant change observed is a marked reduction of O-GlcNAcylated clathrin assembly protein-3 (AP-3) in AD. The reduction is more evident in brain neocortical regions, and there appears to be a negative correlation between O-glycosylated AP-3 and the density of neurofibrillary tangles. These data suggest a possible association between the O-glycosylated AP-3 and AD pathology.


Figures

Fig. 1.
Fig. 1.
Optimal conditions for the galactosyltransferase-mediated galactosylation of brain proteins. Labeling as a function of enzyme concentration (A), substrate concentration (B), and time (C). For each parameter, certain variables were held constant as needed: 100 μg of total proteins, 20 mU of enzyme, and 60 min. A andB were repeated three times, and C was repeated twice, and similar profiles were obtained.
Fig. 2.
Fig. 2.
Comparison of galactosyltransferase labeling of AD and control brain proteins. Proteins from frontal cortex extract of AD and age-matched controls were labeled with galactosyltransferase. Radiolabeled samples were then equally divided and resolved separately on the same 10% SDS-PAGE. The half of the gel visualized by silver staining (A) shows both labeled and unlabeled proteins. The other half of the gel that was subject to fluorography (B) reveals labeled proteins. Positions of molecular weight standards (kilodaltons) are indicated in the middle. Densitometric scanning of lanes 1 and 3of B (the fluorograph) is shown in C. Peak 3, 160 kDa; peak 7, 50 kDa, as mentioned in the text.
Fig. 3.
Fig. 3.
A marked and significant reduction of glycosylated 160 kDa protein occurs in AD middle frontal gyrus. Proteins from middle frontal gyrus of AD and age-matched controls were analyzed with galactosyltransferase labeling. The labeled products were revealed with SDS–PAGE followed by fluorography. A, Fluorographs of labeled proteins from two representative AD and control cases.Arrowheads indicate the 160 kDa protein.B, Densitometric scanning profiles of control case 1 and AD case 1 shown in A. Peak 3 represents the 160 kDa protein band. C, Densitometric values gathered from two bands on the scanned autofluorographs, the intensity of which was relatively consistent among all AD and control samples (peaks 4, 8), were used for normalization between fluorographs. Densitometric values (optical density) for the 160 kDa 3H-galactosylated protein from all 11 cases of AD and 10 cases of non-AD controls were analyzed by Student’st test. Data are expressed as mean ± SEM.D, Densitometric values of six major3H-galactosylated protein bands other than the 160 kDa protein from the same cases were also analyzed by Student’st test. None of the AD versus control comparisons were statistically significant. E, Relation betweenO-glycosylated 160 kDa protein and NFT density of the same tissues.
Fig. 4.
Fig. 4.
Anterior cerebella of AD do not show a significant reduction in the glycosylated 160 kDa protein. Proteins from the anterior cerebella of 11 AD cases and 9 age-matched control cases were analyzed with galactosyltransferase labeling. A, Representative fluorographs of two AD and two controls, witharrowheads indicating the 160 kDa protein band.B, Densitometric scanning profiles of fluorograph from both one representative AD and one control case. Peak 3represents the 160 kDa protein band. C, After normalizing to two unchanging bands on the scanned fluorographs, densitometric values (optical density) for the 160 kDa3H-galactosylated protein from all 11 cases of AD and 9 cases of non-AD controls were analyzed by Student’s ttest. Data are expressed as mean ± SEM.
Fig. 5.
Fig. 5.
The 160 kDa protein is modified by O-linked singleN-acetylglucosamine residues. [3H]Galactose-labeled proteins were deglycosylated by PNGase F and resolved on 10% SDS-PAGE. A, Fluorographs demonstrate labeled proteins that are resistant to PNGase F digestion. The arrowhead indicates the 160 kDa protein, and the arrow indicates the 50 kDa protein.B, Coomassie blue-stained gels reveal the overall protein pattern. The migration positions of molecular weight standards (kilodaltons) are indicated. C, The 160 kDa band and ovalbumin band in each group were cut out and counted.D, [3H]Galactose-labeled sample proteins were separated by SDS-PAGE and transferred to a PVDF membrane. The membrane strip corresponding to the position of 160 kDa was cut out, subjected to alkaline-induced β-elimination, and counted. Ovalbumin was used as a control. E, G-50 Sephadex column profile of β-elimination products released from the PVDF membrane.F, Saccharides released by β-elimination were also analyzed by thin layer chromatography using a cellulose-coated plastic plate. The lanes of 160 kDa protein from AD and control were cut separately into 0.5-cm-wide strips and counted. Disaccharide standards were revealed by AgNO3 staining, and their migration positions are indicated by arrows. Closed circles, Control; open circles, AD. All above analyses were performed at least twice on proteins from all three brain regions examined from both AD and controls. These data demonstrate that the 160 kDa protein is modified by O-linked single GlcNAc residues.
Fig. 6.
Fig. 6.
The [3H]galactose-labeled 160 kDa protein is immunoreactive to AP-3 specific antibodies.A, 3H-labeled proteins were analyzed by Western blotting using an AP-3-specific monoclonal antibody, AP180-I, and detected by ECL (shown on the left). A strong immunoreactive band was revealed at 160 kDa (arrowhead). After disappearance of the ECL signals, the same blot was sprayed with EN3HANCE, dried, and subjected to fluorography (shown on the right). The major AP180-I mAb-immunoreactive band is superimposed with the 3H-labeled 160 kDa protein band (arrowheads). B, Aliquots of the same 3H-labeled sample were also analyzed with Western blotting using two other AP-3-specific antibodies, CLAP3 mAb and F1–20 mAb. Both antibodies revealed a 160 kDa protein as a major band. In contrast, an AP-2-specific monoclonal antibody (100/2 mAb) and a clathrin heavy-chain-specific monoclonal antibody (CHC 5.9) did not react with the 3H-labeled 160 kDa protein.C, With secondary antibodies alone, no immunoreactive band was detected. Lane 1, Anti-mouse IgG; lane 2, anti-mouse IgM. F1–20 mAb is mouse IgM; all other antibodies used are mouse IgG. For B andC, results from only control tissues are shown.
Fig. 7.
Fig. 7.
Immunoprecipitated 160 kDa protein is labeled by [3H]galactose and galactosyltransferase.A, Immunoprecipitation of brain extracts was performed using monoclonal anti-AP-3 antibody AP180-I, and the resulting immunoprecipitates were subsequently labeled with [3H]galactose as detailed in Materials and Methods. Coomassie blue staining of the immunoprecipitates revealed a barely visible band at 160 kDa (arrowhead). Fluorograph (two-day exposure) of the same Coomassie blue-stained gel is on the right, showing that the immunoprecipitated 160 kDa protein using the AP180-I mAb was heavily labeled with [3H]galactose. B, Immunoprecipitation was prepared using AP180-I mAb or 100/2 mAb (anti-AP-2). The resulting supernatants (S) and pellets (P) were analyzed by immunoblotting using AP180-I mAb. The 100/2 mAb was used as a control antibody because, like AP180-I mAb, it is IgG2 from mouse ascites fluid. Whereas the majority of AP-3 was present in the pellets when AP180-I mAb was used for immunoprecipitation (lanes 1, 2), no AP-3 was detected in the pellets with the use of 100/2 mAb (lanes 3, 4).
Fig. 8.
Fig. 8.
Two-dimensional gel analysis of AP-3 labeled with [3H]galactose. Immunoprecipitates of AP-3 were labeled with [3H]galactose as described in Materials and Methods. The samples were then equally divided and resolved separately on duplicated 2-dimensional gels. One gel was subjected to fluorography (A), showing labeled AP-3 (10 d exposure). The other gel was analyzed with immunoblotting using the AP180-I mAb (B). The acid edge is to the left. The asterisk indicates the position of the internal standard, tropomyosin (pI, 5.2; molecular weight, 32.7 kDa). Positions of protein markers (in kilodaltons) are indicated between the panels. The AP180-I mAb-immunoreactive spot that was not3H-galacosylated is indicated with anarrow.
Fig. 9.
Fig. 9.
Glycosylated AP-3 is reduced significantly in AD brains. Extracts from middle frontal gyri of AD and age-matched controls were immunoprecipitated using AP180-I mAb and subsequently labeled with [3H]galactose. A, Coomassie blue-stained gel; B, corresponding fluorograph. Lanes 1 and 2 are two representative controls, and lanes 4 and5 are two AD cases. The migration positions of IgG heavy chain and AP-3 are indicated. Positions of protein markers (lane 3 in both panels) are indicated between the panels.

Similar articles

Cited by

References

    1. Ahle S, Ungewickell E. Purification and properties of a new clathrin assembly protein. EMBO J. 1986;5:3143–3149. - PMC - PubMed
    1. Ahle S, Eichelsbacher U, Ungewickell E. Structural relationships between clathrin assembly proteins from the Golgi and the plasma membrane. EMBO J. 1988;7:919–929. - PMC - PubMed
    1. Alzheimer A. Uber eine eigenartige Erkrangkung der Himrinde. All Z Psychiatr. 1907;64:146–148.
    1. Arnold CS, Johnson GVW, Cole RN, Dong DLY, Lee M, Hart GW. The microtubule-associated protein tau is extensively modified with O-linked N-acetylglucosamine. J Biol Chem. 1996;271:28741–28744. - PubMed
    1. Arriagada PV, Growdon JH, Hedley-Whyte T, Hyman BT. Neurofibrillary tangles but not senile plaques parallel duration and severity of Alzheimer’s disease. Neurology. 1992;42:631–639. - PubMed

Publication types

MeSH terms