. 1998 Apr 1;18(7):2437-48.
doi: 10.1523/JNEUROSCI.18-07-02437.1998.

Dentate gyrus basket cell GABAA receptors are blocked by Zn2+ via changes of their desensitization kinetics: an in situ patch-clamp and single-cell PCR study

Affiliations

Dentate gyrus basket cell GABAA receptors are blocked by Zn2+ via changes of their desensitization kinetics: an in situ patch-clamp and single-cell PCR study

T Berger et al. J Neurosci. .

Abstract

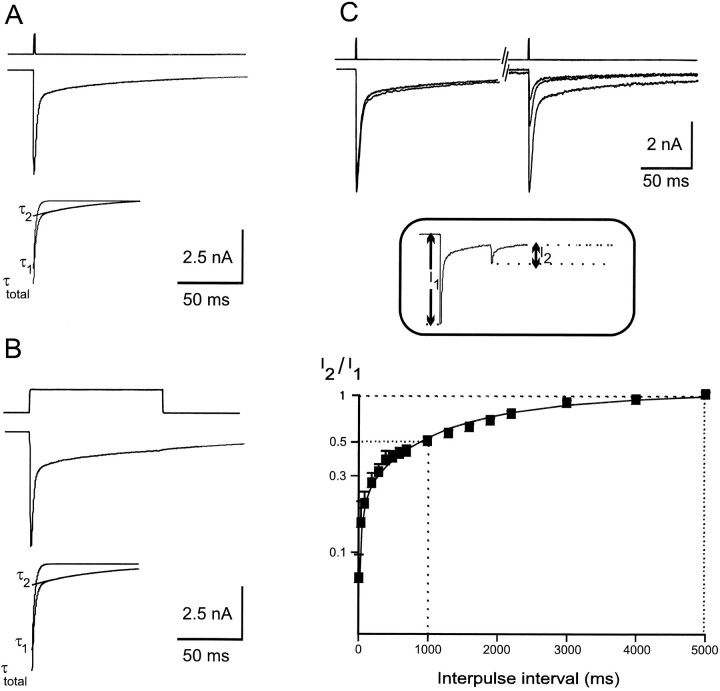
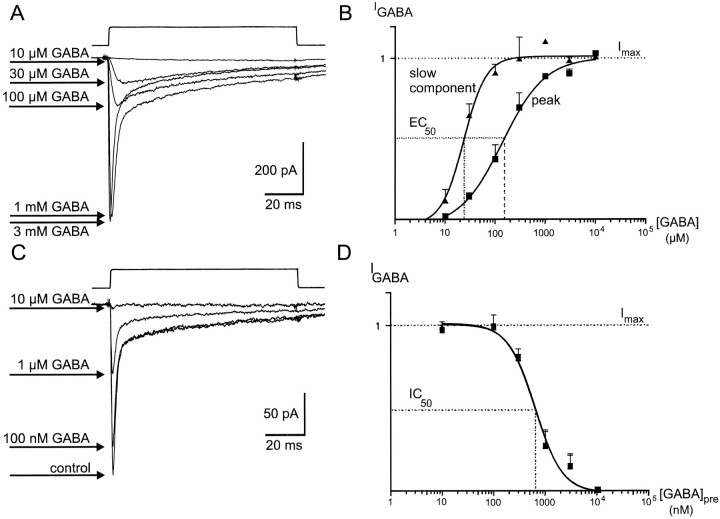
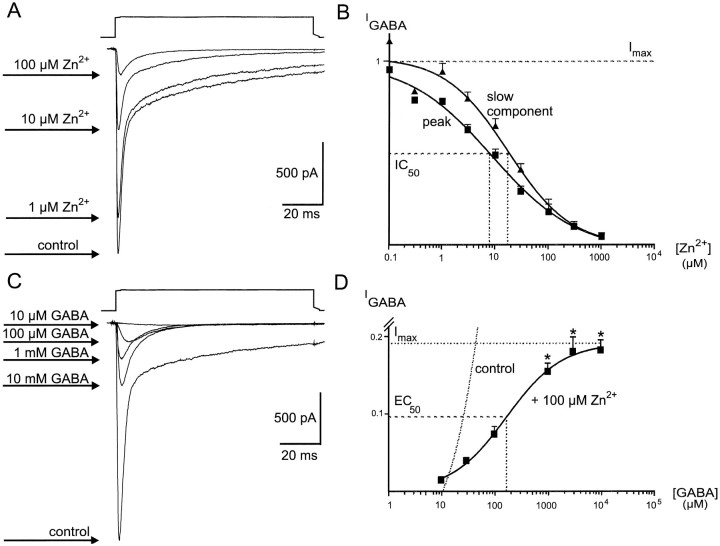
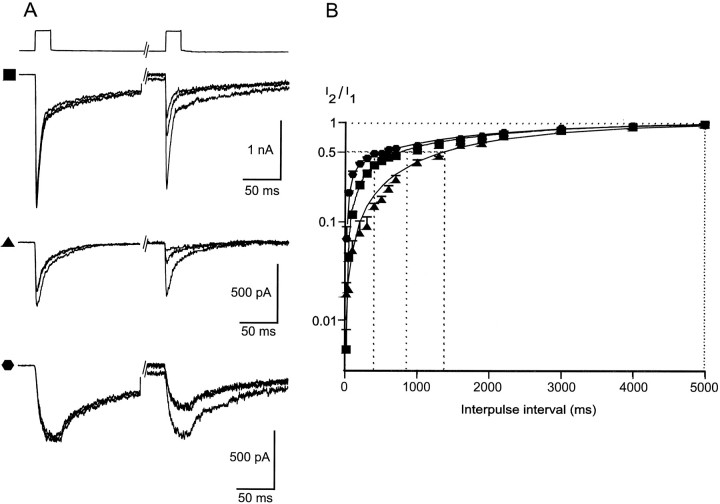
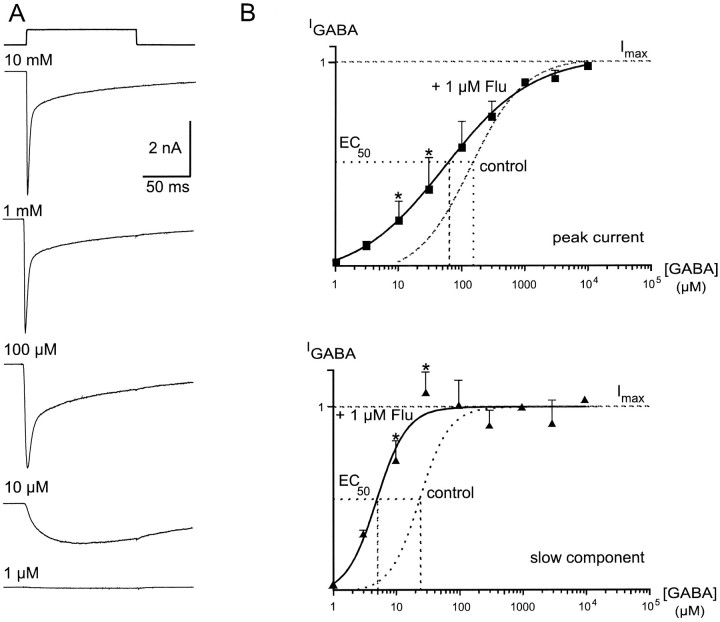
Although GABA type A receptors (GABAARs) in principal cells have been studied in detail, there is only limited information about GABAARs in interneurons. We have used the patch-clamp technique in acute rat hippocampal slices in combination with single-cell PCR to determine kinetic, pharmacological, and structural properties of dentate gyrus basket cell GABAARs. Application of 1 mM GABA (100 msec) to nucleated patches via a piezo-driven fast application device resulted in a current with a fast rise and a marked biexponential decay (time constants 2.4 and 61.8 msec). This decay could be attributed to strong receptor desensitization. Dose-response curves for the peak and the slow component yielded EC50 values of 139 and 24 microM, respectively. Zn2+ caused a marked blocking effect on both the peak and the slow component via a noncompetitive mechanism (IC50 values of 8 and 16 microM). This led to an acceleration of the slow component as well as a prolongation of recovery from desensitization. Zn2+ sensitivity was suggested to depend on the absence of gamma-subunits in GABAARs. To test this hypothesis we performed single-cell reverse transcription PCR that revealed primarily the presence of alpha2-, beta2-, beta3-, gamma1-, and gamma2-subunit mRNAs. In addition, flunitrazepam increased the receptor affinity for its agonist, indicating the presence of functional benzodiazepine binding sites, i.e., gamma-subunits. Thus, additional factors seem to co-determine the Zn2+ sensitivity of native GABAARs. The modulatory effects of Zn2+ on GABAAR desensitization suggest direct influences on synaptic integration via changes in inhibition and shunting at GABAergic synapses.


Figures

Fig. 1.
Fig. 1.
Deactivation and desensitization kinetics.A, GABA (1 mm) was applied for 1 msec to a basket cell nucleated patch. The current decay (τtotal) could be described by the sum of two exponentials termed τ1 and τ2, as shown in the bottom pannel of A. The open tip response is displayed above the current traces in this and all other figures. B, Application of 1 mm GABA for 100 msec to the same patch resulted in a current flow with similar amplitude, rise time, and decay time constants. C, The recovery from desensitization was studied with a protocol of two 1 msec pulses of 1 mm GABA with variable interpulse intervals. The extent of recovery from desensitization was obtained from the amplitude ratio of the second pulse divided by the first (I2/I1). The current amplitudes were both measured from the baseline directly before the corresponding agonist application (shown in theinset). The ratios obtained from eight nucleated patches were plotted semilogarithmically against the interpulse interval and fitted with a biexponential function.
Fig. 2.
Fig. 2.
GABA dose–response curve. A, Different concentrations of GABA (as indicated) were applied for 100 msec to the same nucleated patch. The current responses were superimposed to show their different kinetic behavior. Responses to concentrations ≤100 μm were dominated by a slow rise and decay time constant. B, Amplitudes for peak and slow component from 10 patches (IGABA) were normalized to that obtained at 1 mm GABA and were plotted semilogarithmically against the applied GABA concentrations. These data points were used to construct dose–response curves for both components. In both curves, each point represents 1–10 agonist applications. C, Before application of 1 mmGABA for 100 msec, different low GABA concentrations (as indicated) were preapplied to the patch via the control barrel of the fast application tool to predesensitize the GABAA receptors. The current responses were superimposed to make them comparable. All data except the trace with 10 μm GABA preapplication are from the same patch. D, The data from eight nucleated patches were used for the construction of semilogarithmical dose–response plots of the current induced by 1 mm GABA (IGABA) against the preapplied GABA concentration. The plots for peak and slow component are almost identical, i.e., there were no significant differences between the peak and the slow component regarding the GABA predesensitization. Eachpoint represents two to six experiments.
Fig. 3.
Fig. 3.
Zn2+ blocks the GABA-induced current via a noncompetitive mechanism. A, GABA (1 mm) was applied for 100 msec either alone (control) or in combination with different Zn2+ concentrations (as indicated).B, From eight nucleated patches a semilogarithmical dose–response curve for the Zn2+ block was constructed for the peak current and the slow component, respectively. In both curves, each point represents one to eight agonist applications. C, Different GABA concentrations (as indicated) were applied for 100 msec in the presence of 100 μm Zn2+ to the same nucleated patch to study the mechanism of blockade. GABA (1 mm) was first applied without Zn2+ as control. D, A semilogarithmical dose–response curve for GABA in the presence of Zn2+ was constructed from eight nucleated patches showing the noncompetitive mechanism of block. The peak currents (IGABA) were normalized with respect to the response activated by 1 mm GABA alone. Although the EC50 was not changed significantly in comparison to GABA alone, the Imax was reduced to 19% of the original value (see dashed control dose–response relationship taken from Fig. 2B). Note the calibration of the y-axis. Application of 1, 3, and 10 mm GABA yielded significantly smaller responses in combination with 100 μm Zn2+ than without (*, one-way ANOVA; p < 0.01). Eachpoint represents four to eight experiments.
Fig. 4.
Fig. 4.
Zn2+ slows the recovery from desensitization of the GABAARs. A, GABA (1 mm) (▪), 1 mm GABA plus 30 μm Zn2+ (▴), and 30 μmGABA (⬡) were applied to the same nucleated patch. Zn2+ was applied before and together with the agonist. Although the current responses to 1 mm GABA with and without Zn2+ showed almost identical rise times, 30 μm GABA had a much slower onset. All three current responses had different decay kinetics: 1 mm GABA decayed biexponentially, 30 μm GABA decayed monoexponentially, and 1 mm GABA plus 30 μmZn2+ showed a much faster decay of the slow component in comparison to control. The response to 30 μmGABA showed differences between desensitization and deactivation kinetics. The recovery from desensitization was studied with a protocol of two 20 msec pulses with variable interpulse intervals. Current traces with 300, 1000, and 5000 msec interpulse intervals are shown.B, The extent of recovery from desensitization was obtained from the amplitude ratio of the second pulse divided by the first (I2/I1) (also see Fig. 1C). The ratio obtained from four nucleated patches was plotted semilogarithmically against the interpulse interval and fitted with a biexponential function. The different times needed to obtain half-maximal recovery are indicated bydashed lines for the three conditions. ▪, 1 mm GABA; ▴, 1 mm GABA plus 30 μm Zn2+; ⬡, 30 μmGABA.
Fig. 5.
Fig. 5.
Flunitrazepam shifts the EC50 for GABA to lower concentrations. A, Flunitrazepam (1 μm) was coapplied with different GABA concentrations (as indicated) to the same nucleated patch. Even concentrations as low as 100 μm GABA induced a biexponential response.B, The peak amplitudes (IGABA) from six patches were plotted semilogarithmically against the applied GABA concentrations (+ 1 μm Flu). These data points were used to construct the sigmoidal dose–response curve. In a similar way the semilogarithmical dose–response curve of the slow component was constructed. For better comparison the original GABA dose–response relationships without flunitrazepam (control; taken from Fig.2B) are shown as dashed curves. In both curves each point represents one to six experiments. Application of 10 and 30 μm GABA yielded significantly higher responses in combination with 1 μmflunitrazepam than without (*, one-way ANOVA; p < 0.01).

Similar articles

Cited by

References

    1. Assaf YS, Chung S-H. Release of endogenous Zn2+ from brain tissue during activity. Nature. 1984;308:734–736. - PubMed
    1. Buhl EH, Otis TS, Mody I. Zinc-induced collapse of augmented inhibition by GABA in a temporal lobe epilepsy model. Science. 1996;271:369–373. - PubMed
    1. Celentano JJ, Wong RKS. Multiphasic desensitization of the GABAA receptor in outside-out patches. Biophys J. 1994;66:1039–1050. - PMC - PubMed
    1. Clements JD. Transmitter timecourse in the synaptic cleft: its role in central synaptic function. Trends Neurosci. 1996;19:163–171. - PubMed
    1. Colquhoun D, Jonas P, Sakmann B. Action of brief pulses of glutamate on AMPA/kainate receptors in patches from different neurones of rat hippocampal slices. J Physiol (Lond) 1992;458:261–287. - PMC - PubMed

Publication types

LinkOut - more resources