. 1998 Apr 1;18(7):2475-85.
doi: 10.1523/JNEUROSCI.18-07-02475.1998.

Multiple signaling pathways regulate cell surface expression and activity of the excitatory amino acid carrier 1 subtype of Glu transporter in C6 glioma

Affiliations

Multiple signaling pathways regulate cell surface expression and activity of the excitatory amino acid carrier 1 subtype of Glu transporter in C6 glioma

K E Davis et al. J Neurosci. .

Abstract

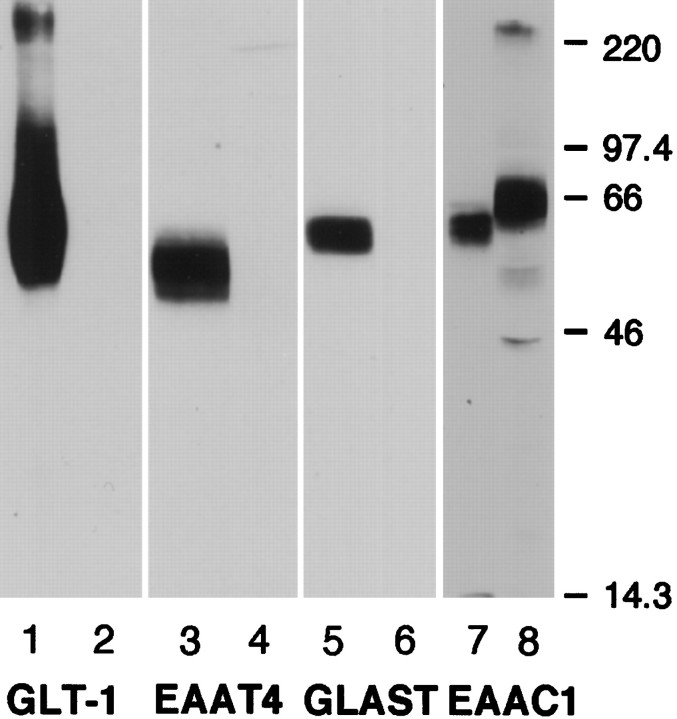
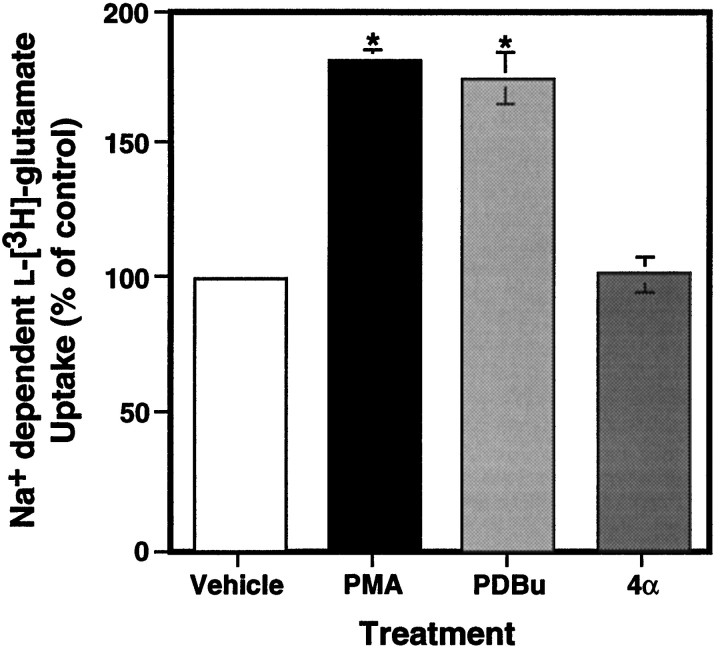
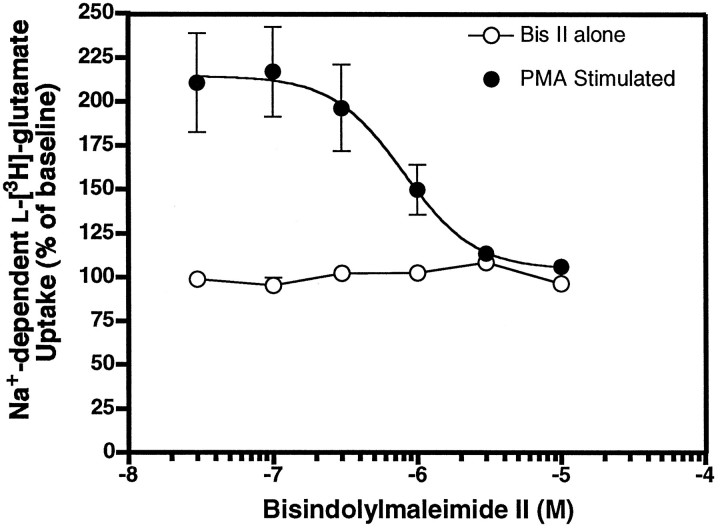
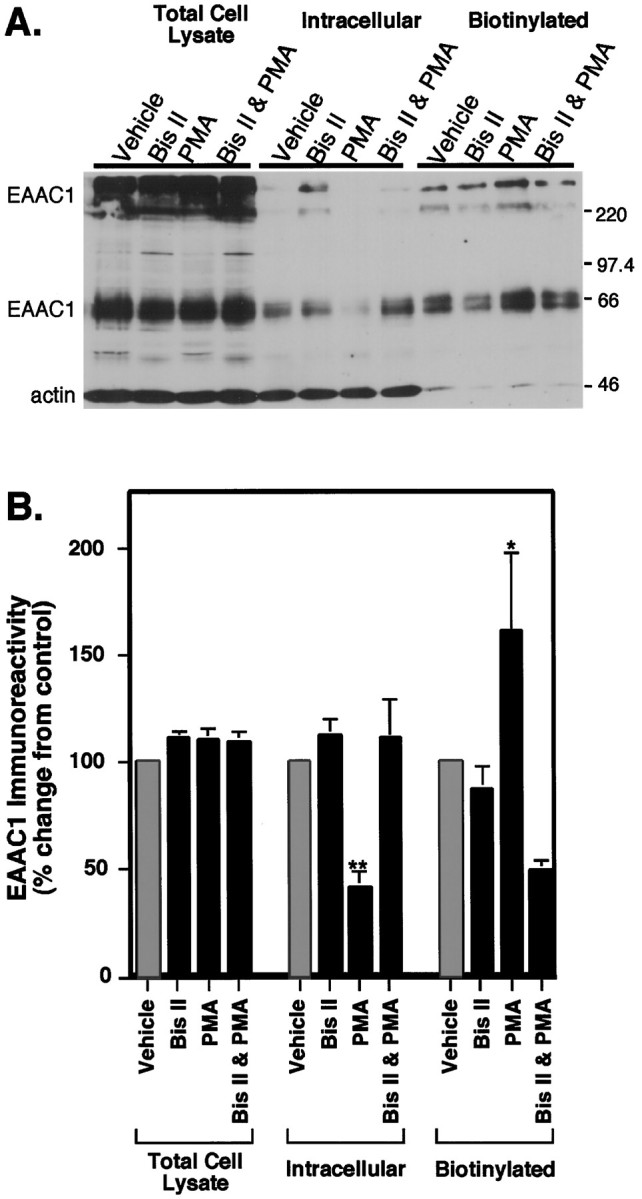
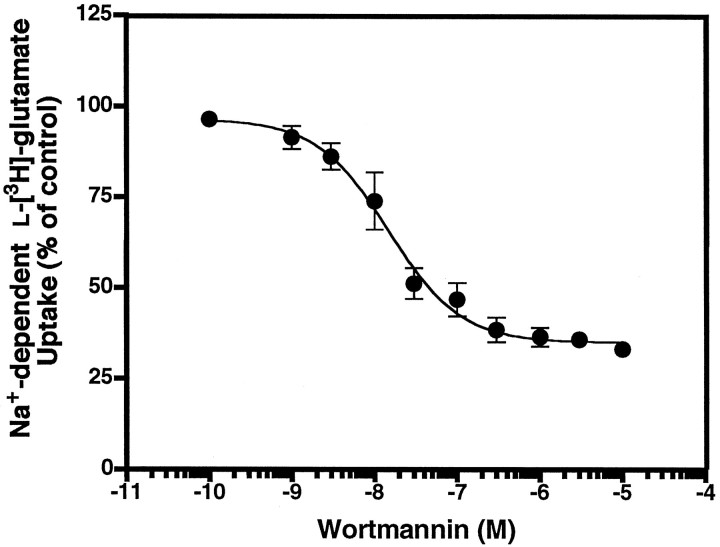
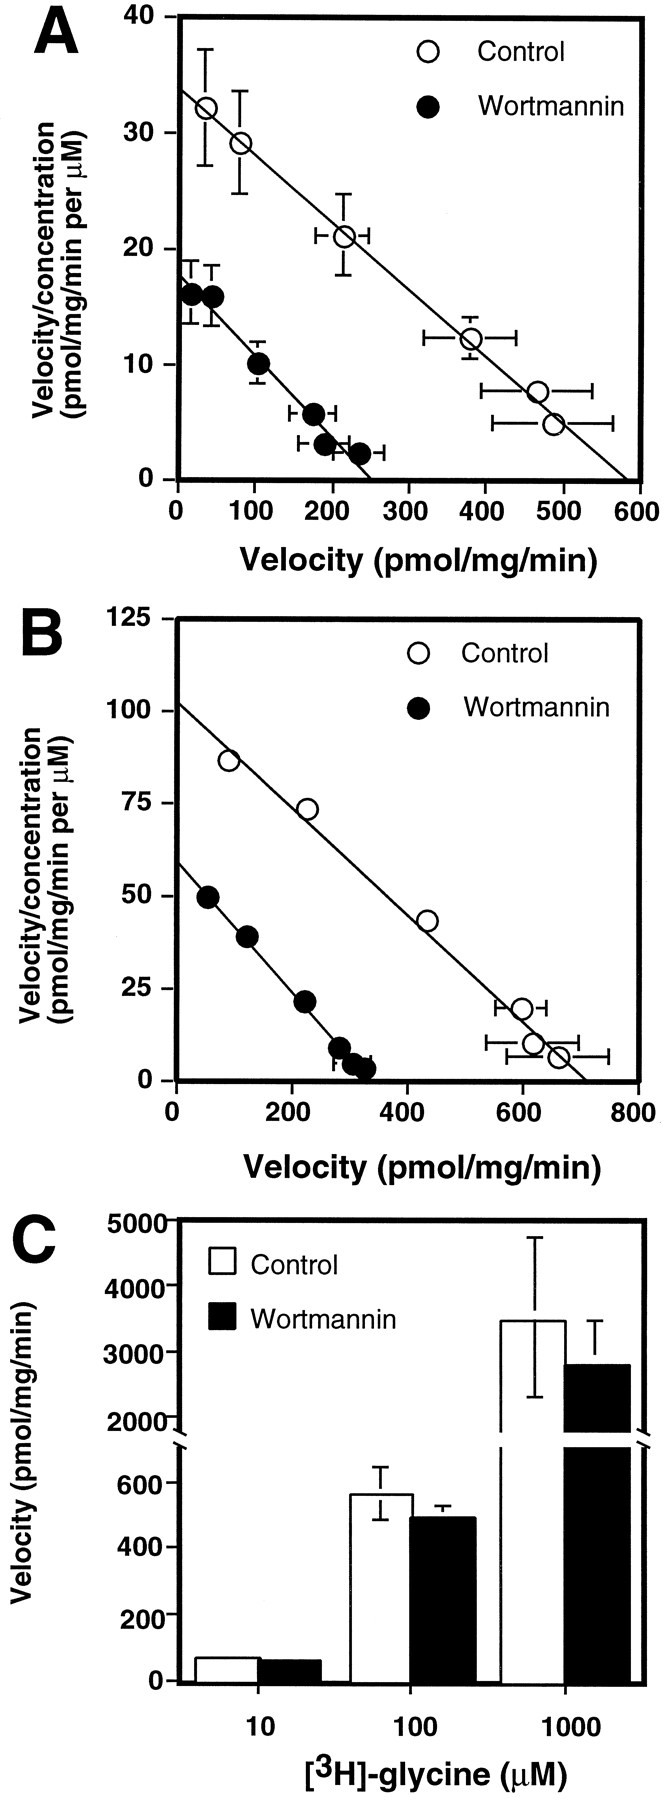
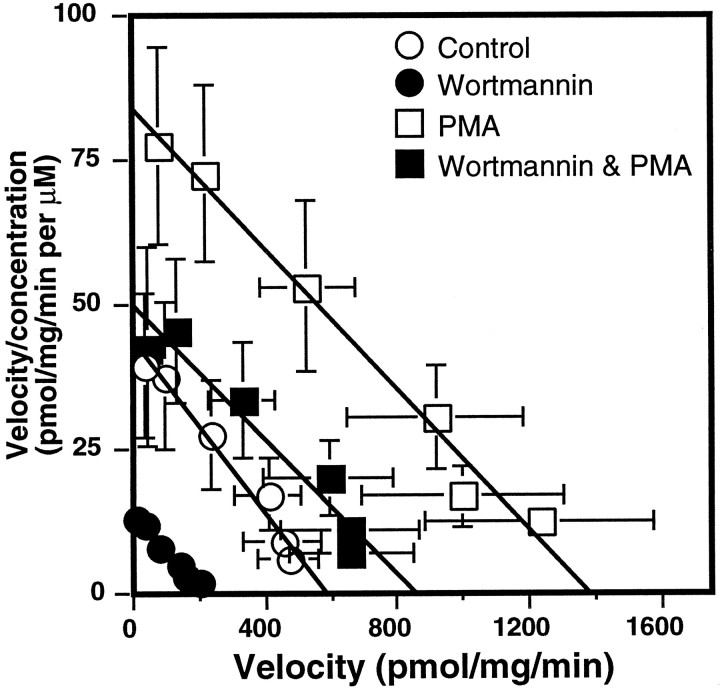
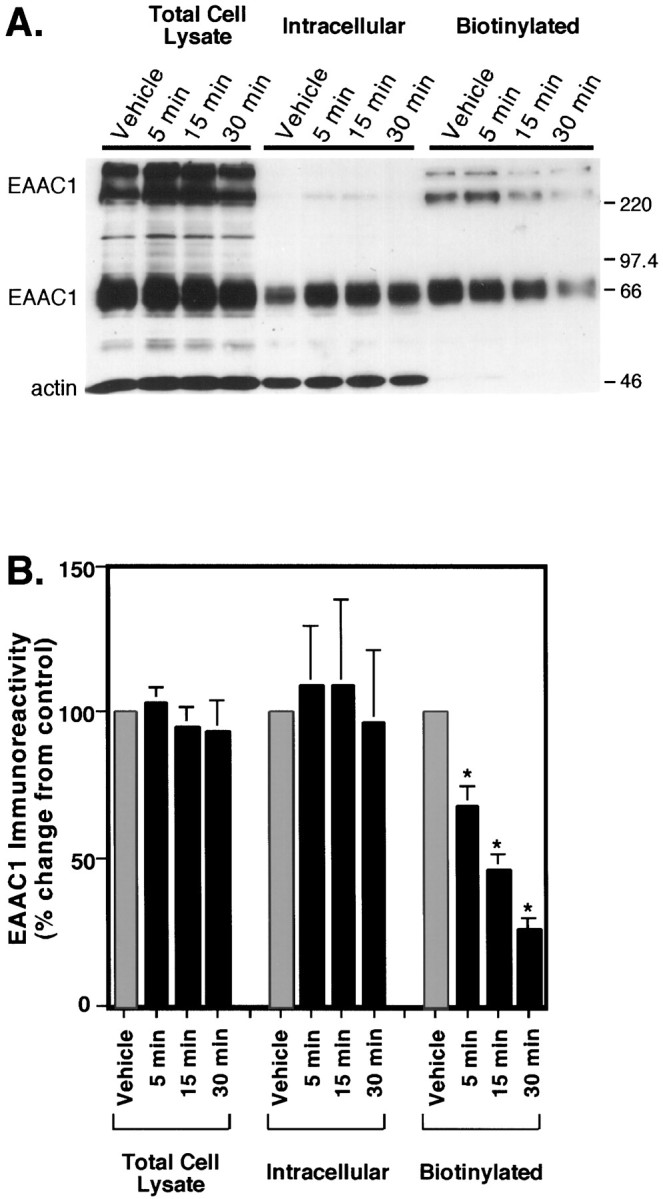
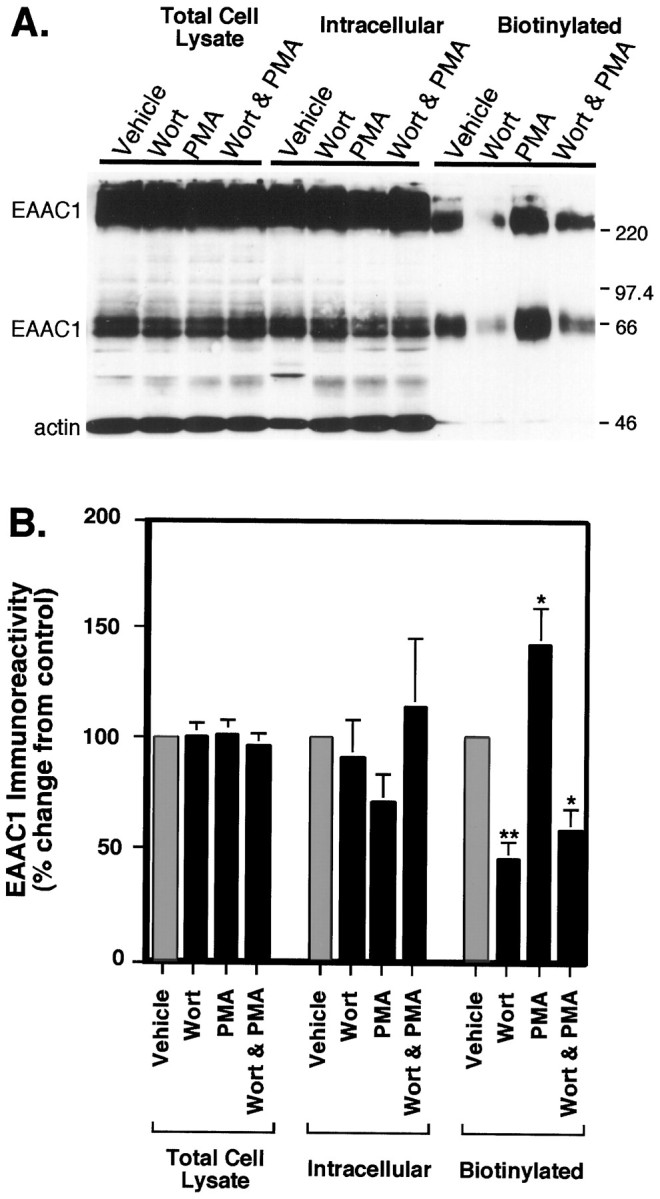
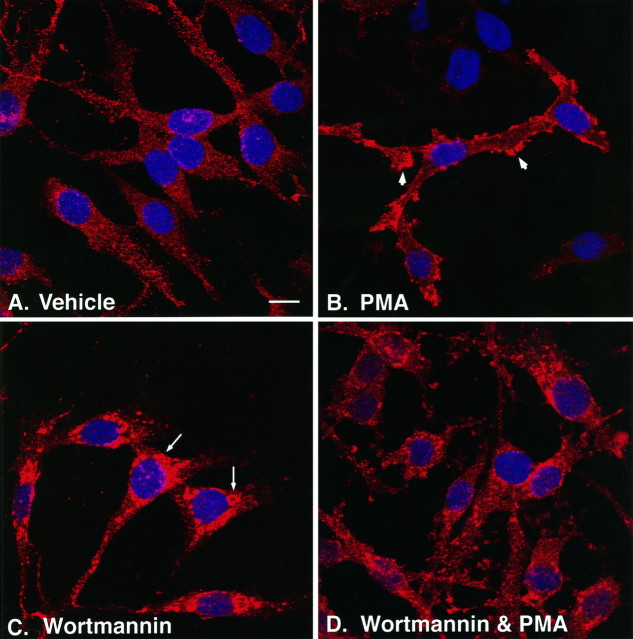
Neuronal and glial sodium-dependent transporters are crucial for the control of extracellular glutamate levels in the CNS. The regulation of these transporters is relatively unexplored, but the activity of other transporters is regulated by protein kinase C (PKC)- and phosphatidylinositol 3-kinase (PI3K)-mediated trafficking to and from the cell surface. In the present study the C6 glioma cell line was used as a model system that endogenously expresses the excitatory amino acid carrier 1 (EAAC1) subtype of neuronal glutamate transporter. As previously observed, phorbol 12-myristate 13-acetate (PMA) caused an 80% increase in transporter activity within minutes that cannot be attributed to the synthesis of new transporters. This increase in activity correlated with an increase in cell surface expression of EAAC1 as measured by using a membrane-impermeant biotinylation reagent. Both effects of PMA were blocked by the PKC inhibitor bisindolylmaleimide II (Bis II). The putative PI3K inhibitor, wortmannin, decreased L-[3H]-glutamate uptake activity by >50% within minutes. Wortmannin decreased the Vmax of L-[3H]-glutamate and D-[3H]-aspartate transport, but it did not affect Na+-dependent [3H]-glycine transport. Wortmannin also decreased cell surface expression of EAAC1. Although wortmannin did not block the effects of PMA on activity, it prevented the PMA-induced increase in cell surface expression. This trafficking of EAAC1 also was examined with immunofluorescent confocal microscopy, which supported the biotinylation studies and also revealed a clustering of EAAC1 at cell surface after treatment with PMA. These studies suggest that the trafficking of the neuronal glutamate transporter EAAC1 is regulated by two independent signaling pathways and also may suggest a novel endogenous protective mechanism to limit glutamate-induced excitotoxicity.


Figures

Fig. 1.
Fig. 1.
Western blot analysis of sodium-dependent glutamate transporters endogenously expressed in C6 glioma. C6 glioma were harvested, and 50 μg of protein was loaded in each lane (lanes 2, 4, 6, 8). Membrane homogenates from rat brain regions known to be enriched in a particular subtype of transporter were used as positive controls. Rat cortex (5 and 50 μg) was loaded in lanes 1 and 7, respectively; 50 μg of rat cerebellum was loaded in lanes 3 and 5. The blots were probed with anti-GLT1 (lanes 1 and 2), anti-EAAT4 (lanes 3 and 4), anti-GLAST (lanes 5 and 6), and anti-EAAC1 (lanes 7 and 8). Only the EAAC1 subtype of glutamate transporter is expressed in C6 glioma. The immunoblot is representative of at least two independent experiments.
Fig. 2.
Fig. 2.
Effects of PMA and its analogs on Na+-dependentl-[3H]-glutamate uptake in C6 glioma cells. Cells were treated with vehicle, 100 nm PMA, 1 μm phorbol-12,13-dibutyrate (PDBu), or 100 nm 4α-phorbol () for 30 min before measurement of Na+-dependentl-[3H]-glutamate transport. PMA and PDBu increased glutamate uptake significantly over vehicle and 4α-treated cells. Data are the mean ± SEM of at least three independent observations and were compared by ANOVA with a Fisher’s Protected Least Significant Difference (PLSD) post hocanalysis (*p < 0.001).
Fig. 3.
Fig. 3.
Bisindolylmaleimide II-mediated inhibition of Na+-dependentl-[3H]-glutamate transport (0.5 μm) in vehicle-treated (○) and PMA-treated (•) C6 glioma. Cells were preincubated with Bis II for 5 min, and either vehicle (DMSO) or PMA (100 nm) was added for 30 min before the measurement of Na+-dependentl-[3H]-glutamate transport.l-[3H]-glutamate uptake was measured and expressed as the percentage of baseline (no Bis II or PMA) activity. Data points represent the mean ± SEM of at least three independent experiments, each performed in triplicate. Data for the component of activity that was sensitive to Bis II were fit to a single site with Prism software. The IC50 value was 804 nm.
Fig. 4.
Fig. 4.
Analysis of distribution of EAAC1 immunoreactivity in C6 glioma after treatment with PMA. Cells were preincubated with either vehicle (DMSO) or Bis II (10 μm) for 5 min, followed by the addition of either vehicle or 100 nm PMA for an additional 30 min. Then the cells were biotinylated as described in Materials and Methods. A, Immunoblot of cell lysate, intracellular, and biotinylated fractions of C6 glioma. Loaded in all lanes was 50 μl of each sample, and blots were probed with anti-EAAC1 (66 kDa bands and bands above 220 kDa) and anti-actin (46 kDa band) to determine the extent of intracellular protein labeling by the biotin reagent. B, Quantitation of immunoblots demonstrating the effects of Bis II and PMA alone and in combination. Films were scanned and quantitated densitometrically, and EAAC1 immunoreactivity values were normalized for actin in the lysate fraction. Data represent the mean ± SEM from five individual experiments and are expressed as a percentage of the vehicle treatment for each fraction. There were no changes in EAAC1 levels between treatments in the total cell lysate fraction, but in the intracellular fraction PMA caused a significant decrease in EAAC1 levels, as compared with all other treatments by ANOVA (**p < 0.005; DMSO vs PMA; Fisher’s PLSD), which was blocked by Bis II (p < 0.001; PMA and Bis II vs PMA; Fisher’s PLSD). In the biotinylated fraction, PMA increased the cell surface expression of EAAC1 (*p< 0.05; DMSO vs PMA; Fisher’s PLSD), and Bis II alone had no effect on cell surface expression but blocked the effects of PMA on biotinylated EAAC1 (p < 0.001; Bis and PMA vs PMA; Fisher’s PLSD). The levels of biotinylated EAAC1 immunoreactivity in cells treated with both Bis II and PMA were not significantly different from control.
Fig. 5.
Fig. 5.
Wortmannin-mediated inhibition of Na+-dependentl-[3H]-glutamate uptake (0.5 μm) in C6 glioma. Wortmannin was applied to cells for 30 min, and l-[3H]-glutamate uptake was assayed in triplicate. Values are expressed as the mean ± SEM for four independent experiments. Data for the component of activity that was sensitive to wortmannin were fit to a single site, using Prism software. The IC50 value for this sensitive component was 14.9 nm.
Fig. 6.
Fig. 6.
Effect of wortmannin on the concentration dependence of Na+-dependentl-[3H]-glutamate uptake in C6 glioma.A, Wortmannin (•; 100 nm) or vehicle (○) was added to cells for 30 min before uptake assay. Values are expressed as the mean ± SEM of six independent experiments performed in triplicate. TheKm was 17.6 ± 1.2 μm for controls and 15.0 ± 1.2 μm for wortmannin treatment (no significant difference; p > 0.05). TheVmax values were significantly different, with a Vmax of 589 ± 95 pmol · mg−1 · min−1 for controls and 256 ± 40 pmol · mg−1 · min−1 for wortmannin treatment (p < 0.01; unpaired Student’s t test). B, Effect of wortmannin on the concentration dependence of Na+-dependentd-[3H]-aspartate uptake in C6. Cells were incubated with 100 nm wortmannin (•) or vehicle (○) for 30 min before uptake assay. Values are expressed as the mean ± SEM of three independent experiments, each performed in triplicate. The Vmax for controls was 719 ± 72 pmol · mg−1 · min−1 and for wortmannin was 341 ± 19 pmol · mg−1 · min−1(p < 0.01; unpaired Student’st test). The Km for controls was 7.1 ± 0.3 μm and for wortmannin treatment was 5.9 ± 0.2 μm (p < 0.05; unpaired Student’s t test). C, Effect of wortmannin on Na+-dependentl-[3H]-glycine uptake at 10 or 100 μm or 0.1 mm concentrations of glycine. Wortmannin (▪; 100 nm) or vehicle (□) was added to cells 30 min before uptake assay. Values are the mean ± SEM of at least three independent experiments performed in triplicate (no significant effect by ANOVA).
Fig. 7.
Fig. 7.
Effect of coincubation of wortmannin and PMA on the concentration dependence of Na+-dependentl-[3H]-glutamate uptake in C6 glioma. Cells were preincubated for 5 min with either 100 nmwortmannin or vehicle, and 100 nm PMA or vehicle was added for 30 min before the measurement ofl-[3H]-glutamate uptake activity. Values represent the mean ± SEM of five independent experiments, each performed in triplicate. For control cells (○), theVmax value was 567 ± 94 pmol · mg−1 · min−1, and the Km value was 16.8 ± 2 μm. For PMA-treated cells (□), theVmax value was 1480 ± 330 pmol · mg−1 · min−1, and the Km value was 18.7 ± 2 μm. For wortmannin-treated cells (•), theVmax value was 239 ± 48 pmol · mg−1 · min−1, and the Km value was 19.1 ± 3 μm. For cells treated with both wortmannin and PMA (▪), the Vmax value was 910 ± 190 pmol · mg−1 · min−1, and the Km value was 21.2 ± 3 μm. The Vmax andKm values of all treatments were compared by ANOVA, and significant differences were found between theVmax values of control and PMA-treated cells (p < 0.005; Fisher’s PLSD) and between wortmannin- and wortmannin and PMA-treated cells (p < 0.05; Fisher’s PLSD). No significant differences were found among the Km values of any treatment conditions.
Fig. 8.
Fig. 8.
Time course of the effects of wortmannin on the cellular distribution of EAAC1. C6 glioma were preincubated with 100 nm wortmannin for 5, 15, or 30 min or with vehicle for 30 min before biotinylation. A, Immunoblot of EAAC1 (66 kDa and bands above 220 kDa) and actin (46 kDa band) immunoreactivity in cell lysate, intracellular, and biotinylated fractions. Actin was used to examine the extent of biotinylation of intracellular proteins.B, Quantitation of EAAC1 immunoreactivity, demonstrating a decrease in biotinylated EAAC1 with increasing wortmannin preincubation times. Films were scanned and quantitated densitometrically, and values are expressed as the mean ± SEM of four independent experiments. No significant differences between preincubation times occurred in the lysate or intracellular fractions, but in the biotinylated fraction, EAAC1 at each time point was significantly lower than control (ANOVA; *p < 0.001; Fisher’s PLSD), and differences between time points were significant (ANOVA; 5 vs 30 min, p < 0.001; 5 vs 15 min, p < 0.01; and 15 vs 30 min,p < 0.05; Fisher’s PLSD).
Fig. 9.
Fig. 9.
Analysis of the distribution of EAAC1 immunoreactivity in C6 glioma after treatment with PMA and wortmannin (Wort). Cells were preincubated with either vehicle or 100 nm wortmannin for 5 min, and either vehicle or PMA was added for 30 min before biotinylation. A, Immunoblot of cell lysate, intracellular, and biotinylated fractions of C6 glioma. Sample (50 μl) was loaded in all lanes, and blots were probed with anti-EAAC1 (66 kDa and bands above 220 kDa) and anti-actin (46 kDa band) as a control. B, Quantitation of immunoblots demonstrating the effects of wortmannin and PMA alone and in combination. Films were scanned and quantitated densitometrically, and all EAAC1 values were normalized for actin in the lysate fraction. Data represent the mean ± SEM from six individual experiments and are expressed as a percentage of the control treatment for each fraction. The treatments had no significant effects on EAAC1 levels in the total cell lysate or intracellular fractions. In the biotinylated fraction, wortmannin and wortmannin with PMA both caused significant decreases in cell surface expression of EAAC1 by ANOVA (**p < 0.005; *p < 0.05; Fisher’s PLSD). PMA increased cell surface expression of EAAC1 as compared with control (*p < 0.05; Fisher’s PLSD). There was no significant difference between Wort and Wort & PMA.
Fig. 10.
Fig. 10.
Effects of PMA and wortmannin on the cellular distribution of EAAC1 as examined by immunofluorescent confocal microscopy. Cells were treated with either DMSO (Vehicle) or wortmannin for 5 min, followed by either vehicle or PMA for 30 min. Cells were fixed and labeled with rhodamine-conjugated anti-EAAC1 (red) and DAPI (blue). Serial sections of 0.5 μm were obtained by confocal microscopy at 100× magnification, and sections through the center of the cell corresponding to the largest cross-sectional nuclear area were used for each treatment. These images were representative of multiple fields examined for each treatment from two independent immunofluorescence experiments. In control (vehicle-treated) cultures (A), the cells exhibited dispersed, punctate intracellular immunolabeling. In the presence of PMA (B) there was a marked decrease in intracellular labeling, with a redistribution of transporter to clusters on the cell surface (arrowheads) as well as a morphological change that resembled membrane ruffling. Wortmannin, in contrast to PMA, caused a redistribution of EAAC1 into dense vesicular-like perinuclear deposits (C, arrows). Combined treatment with both wortmannin and PMA caused some morphological changes as well as increased perinuclear immunostaining without the formation of large vesicle-like structures (D). Scale bar, 10 μm.

Similar articles

Cited by

References

    1. Arriza JL, Eliasof S, Kavanaugh MP, Amara SG. Excitatory amino acid transporter 5, a retinal glutamate transporter coupled to a chloride conductance. Proc Natl Acad Sci USA. 1997;94:4155–4160. - PMC - PubMed
    1. Attwell D, Barbour B, Szatkowski M. Nonvesicular release of neurotransmitter. Neuron. 1993;11:401–407. - PubMed
    1. Capogna M, Gahwiler BH, Thompson SM. Presynaptic enhancement of inhibitory synaptic transmission by protein kinase A and C in rat hippocampus in vitro. J Neurosci. 1995;15:1249–1260. - PMC - PubMed
    1. Casado M, Bendahan A, Zafra F, Danbolt NC, Gimenez C, Kanner BI. Phosphorylation and modulation of brain glutamate transporters by protein kinase C. J Biol Chem. 1993;268:27313–27317. - PubMed
    1. Cheatham B, Vlahos CJ, Cheatham L, Wang L, Blenis J, Kahn CR. Phosphatidylinositol 3-kinase activation is required for insulin stimulation of pp70 S6 kinase, DNA synthesis, and glucose transporter translocation. Mol Cell Biol. 1994;14:4902–4911. - PMC - PubMed

Publication types

MeSH terms