. 1998 Apr 1;18(7):2653-66.
doi: 10.1523/JNEUROSCI.18-07-02653.1998.

Differential modulation of high-frequency gamma-electroencephalogram activity and sleep-wake state by noradrenaline and serotonin microinjections into the region of cholinergic basalis neurons

Affiliations

Differential modulation of high-frequency gamma-electroencephalogram activity and sleep-wake state by noradrenaline and serotonin microinjections into the region of cholinergic basalis neurons

E G Cape et al. J Neurosci. .

Abstract

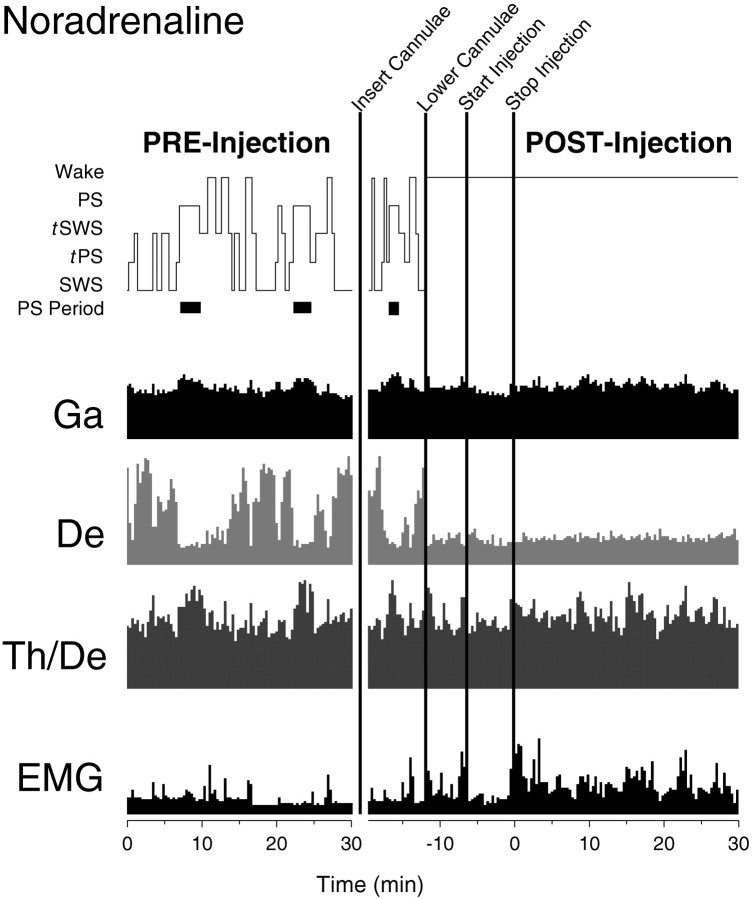
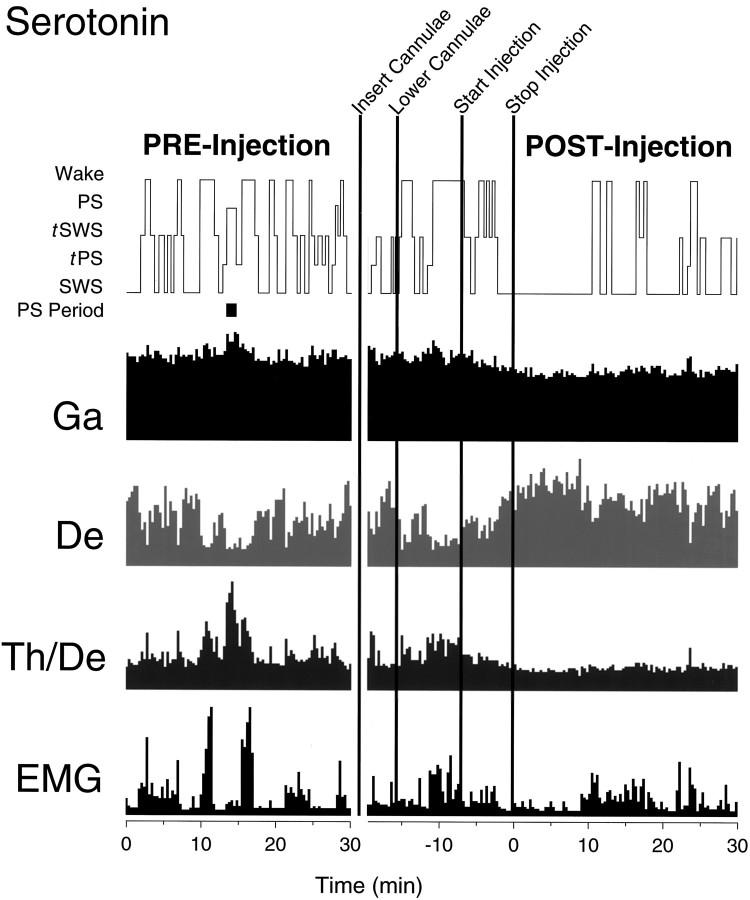
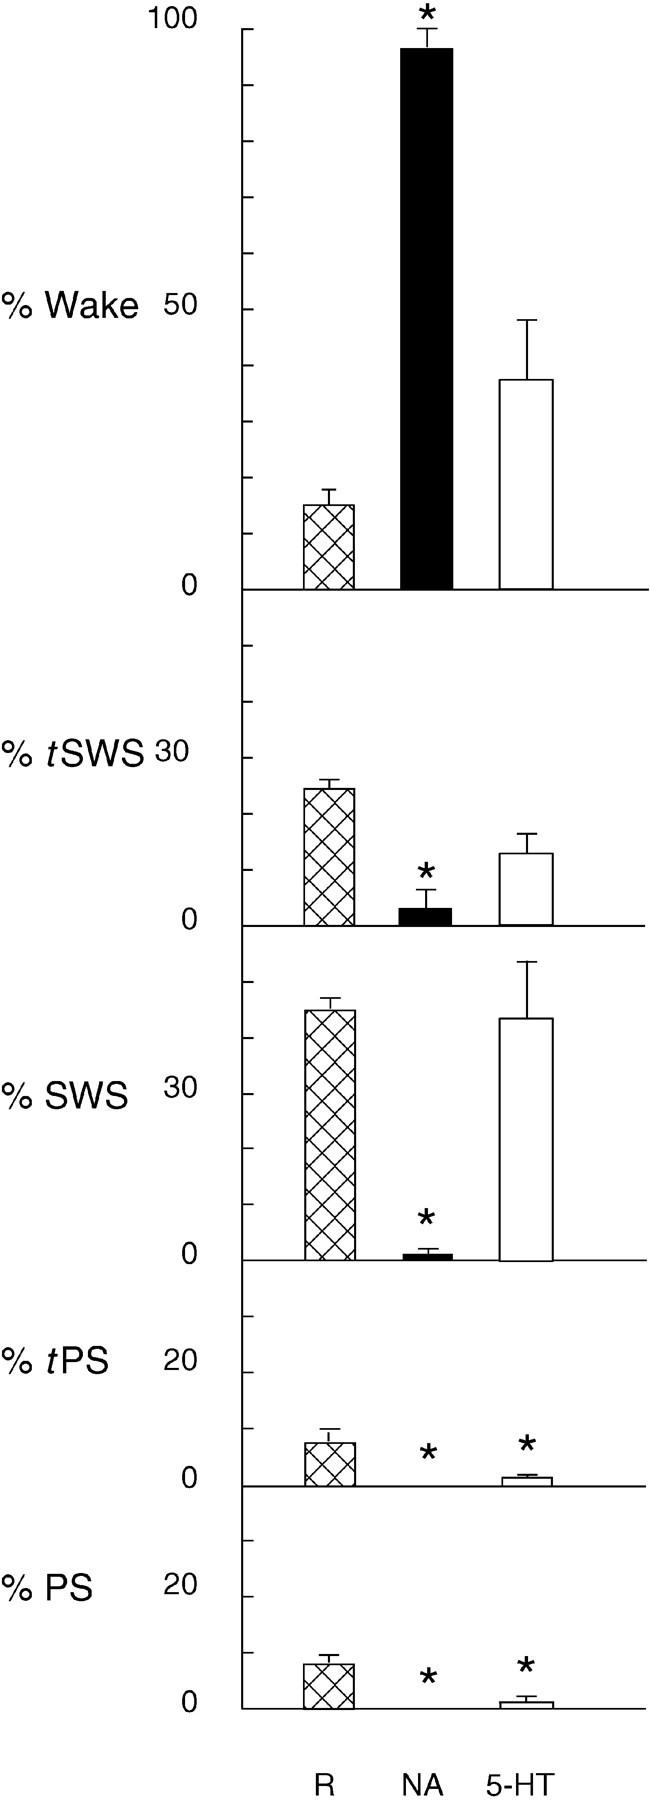
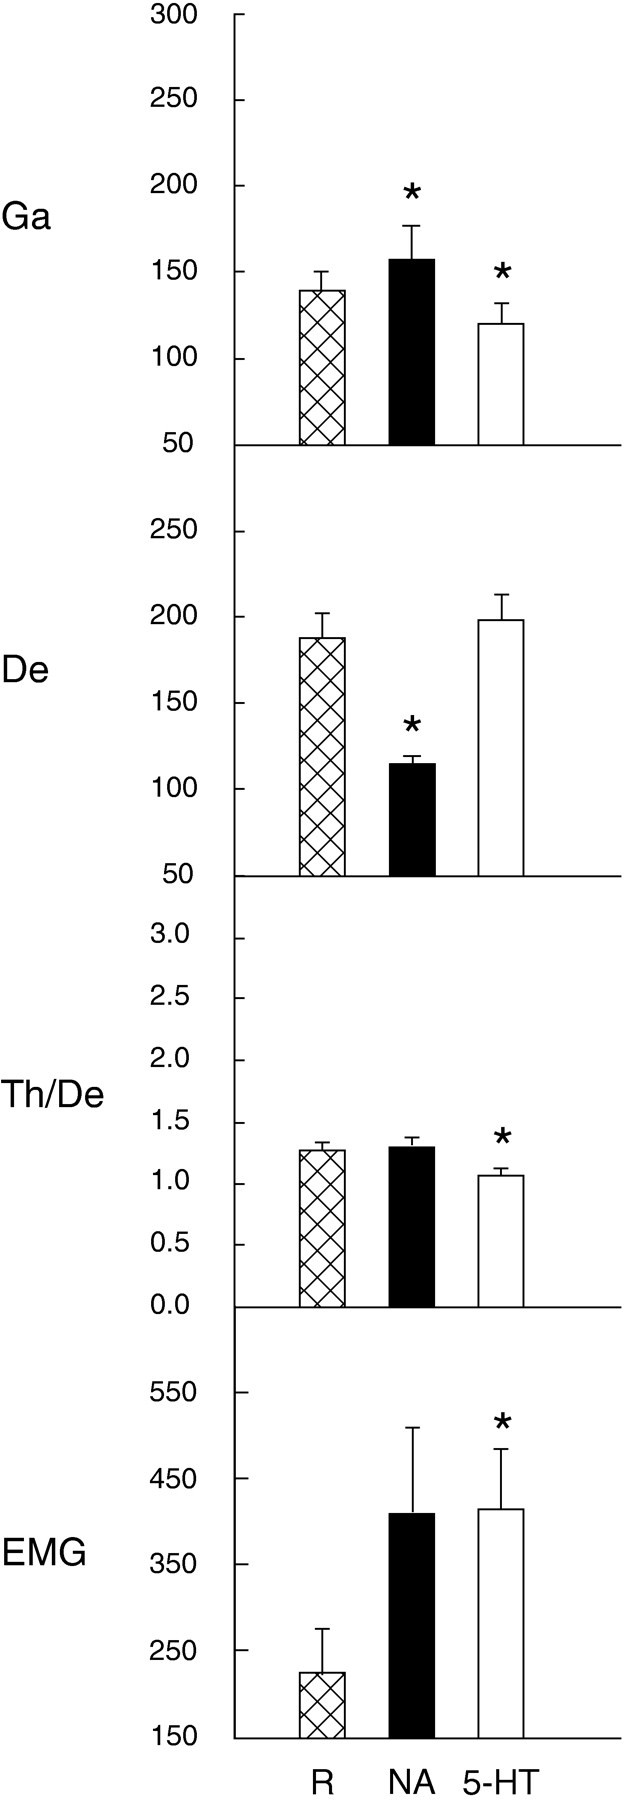
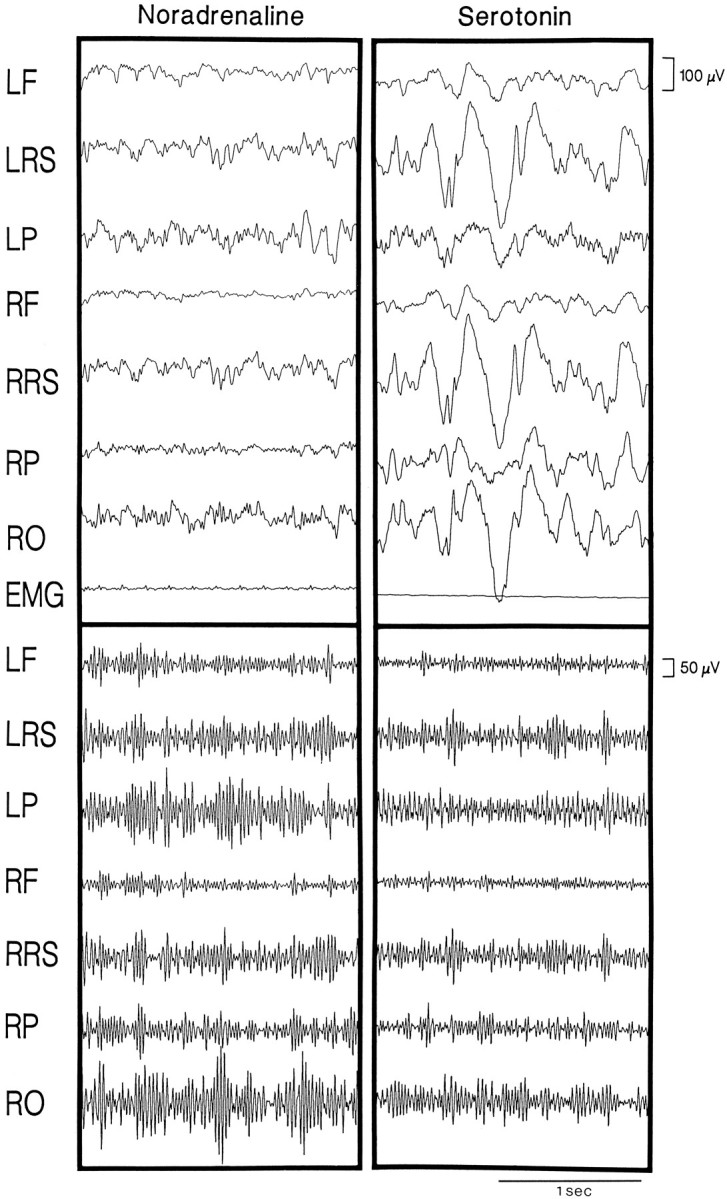
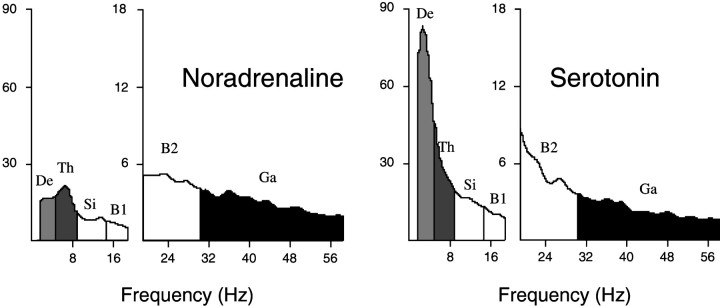
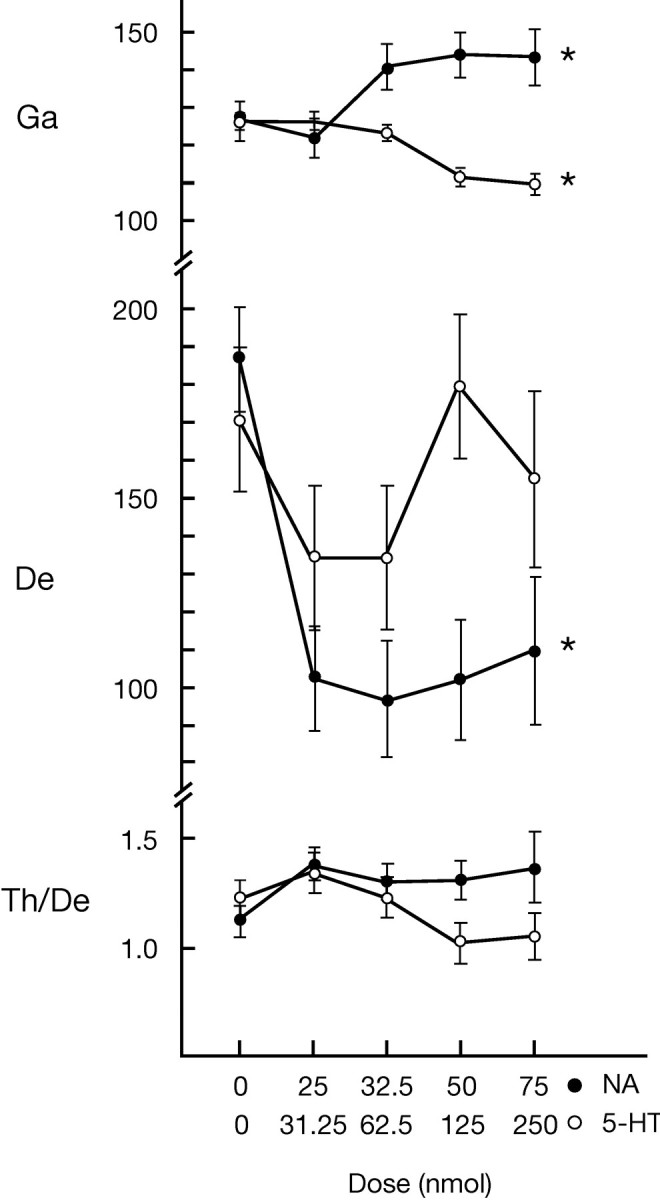
Several lines of evidence indicate that cholinergic basalis neurons play an important role in cortical activation. The present study was undertaken to determine the effect of noradrenergic and serotonergic modulation of the cholinergic neurons on cortical EEG activity and sleep-wake states. The neurotransmitters were injected into the region of the basalis neurons by remote control in freely moving, naturally sleeping-waking rats during the day when the rats are normally asleep the majority of the time. Effects were observed on behavior and EEG activity, including high-frequency gamma activity (30-60 Hz), which has been demonstrated to reflect behavioral and cortical arousal in the rat. Noradrenaline, which has been shown in previous in vitro studies to depolarize and excite the cholinergic cells, produced a dose-dependent increase in gamma-EEG activity, a decrease in delta activity, and an increase in waking. Serotonin, which has been found in previous in vitro studies to hyperpolarize the cholinergic neurons, produced a dose-dependent decrease in gamma-EEG activity with no significant change in amounts of wake or slow wave sleep. Both chemicals resulted in a dose-dependent decrease in paradoxical sleep. These results demonstrate that noradrenaline and serotonin exert differential modulatory effects on EEG activity through the basal forebrain, the one facilitating gamma activity and eliciting waking and the other diminishing gamma activity and not significantly affecting slow wave sleep. The results also confirm that the cholinergic basalis neurons play an important role in cortical activation and particularly in the high-frequency gamma activity that underlies cortical and behavioral arousal of the wake state.


Figures

Fig. 1.
Fig. 1.
A, Schematic drawing of the rat brain (in sagittal view) illustrating chemical microinjections into the region of cholinergic basalis neurons (open circles), which are known to project to the cerebral cortex (dashed lines) and to receive input from noradrenergic and serotonergic afferents (solid lines), respectively, arriving from the dorsal raphe (DR) and locus coeruleus (LC) nuclei in the brainstem [adapted with permission from Jones (1995)]. Bilateral microinjections of Ringer’s, noradrenaline, or serotonin were performed by insertion of inner injection cannulae into chronically indwelling guide cannulae. The cannulae are drawn according to the coordinates used for implantation and the histological verification of their position. At the time of the experiment, inner cannulae, which were filled with the chemical for injection, were inserted first within the guide cannulae (to within ∼2 mm of tip, marked byarrow), where they were held until the time of injection. Immediately before injection, the inner cannulae on both sides were lowered by a remote driving mechanism (∼4 mm) to pass out of the guide cannulae, through the globus pallidus (GP), into the substantia innominata (SI; to ∼2 mm below the guide cannulae, marked by lower arrow), and above the magnocellular preoptic nucleus (MCPO). The diffusion of the chemical solution is depicted according to estimates that are based on previous injections of the same volume (0.5 μl) of neuroanatomical tracers into the basal forebrain (Jones and Yang, 1985; Jones and Beaudet, 1987). B, Drawing of coronal section through the middle of the injection site showing approximate placement of cannulae, based on the location of tracks, in relationship to ChAT-immunostained cells (mapped with the aid of an image analysis system). ac, Anterior commissure; AV, anteroventral thalamic nucleus; CL, centrolateral thalamic nucleus; CPu, caudate putamen;DpMe, deep mesencephalic reticular field;FF, fields of Forel; Gi, gigantocellular reticular field; GiA, gigantocellular reticular field, α part; GiV, gigantocellular reticular field, ventral part; GP, globus pallidus; ic, internal capsule; LC, locus coeruleus;LD, laterodorsal thalamic nucleus; LH, lateral hypothalamic area; LP, lateral posterior thalamic nucleus; MCPO, magnocellular preoptic nucleus;oc, optic chiasm; opt, optic tract;OTuD, olfactory tubercle, deep layer; PC, paracentral thalamic nucleus; PF, parafascicular thalamic nucleus; PnC, pontine reticular field, caudal part; PnO, pontine reticular field, oral part;PnV, pontine reticular field, ventral part;PPTg, pedunculopontine tegmental nucleus;R, red nucleus; RRF, retrorubral field;Rt, reticular thalamic nucleus; SIa, substantia innominata, anterior part; SIp, substantia innominata, posterior part; SN, substantia nigra;st, stria terminalis; VL, ventrolateral thalamic nucleus; VM, ventromedial thalamic nucleus;VTA, ventral tegmental area; ZI, zona incerta.
Fig. 2.
Fig. 2.
Hypnogram (top) and EEG and EMG frequency band activities (bottom) per 20 sec epoch during morning (left) and afternoon (right) recording periods (rat B10). For EEG, γ (Ga, 30.5–58.0 Hz) and δ (De, 1.5–4 Hz) absolute activities and θ/δ ratio (Th, 4.5–8.5 Hz/De, 1.5–4 Hz) from right retrosplenial cortex are displayed. Recording was begun in the morning (∼11:00 A.M. = 0) and continued for ∼30 min before the animal was handled for mock insertion of injection cannulae (during the break marked bydividing line). After relaxation and resumption of sleep (usually in ∼30–45 min), recording was begun again for the afternoon. In this baseline record, 0 marks the approximate time at which an injection would have been performed and thus defines the 30 min baseline period with which the Ringer’s postinjection period was compared (see Fig. 4). In this undisturbed period during baseline recording, the rat is asleep the majority of the time. γ is highest in association with brief periods of active wake (with high EMG activity) and with PS (with low EMG activity) and lowest in association with SWS. δ varies in a reciprocal manner, high in association with SWS and low during both wake and PS. The Th/De ratio is high during brief periods of active wake and highest during PS.Ga, De, and EMG frequency band activities are displayed as amplitude units scaled to maximum activity. In this figure, the maximum amplitude for Gais 157, for De is 417, and for EMG is 630 (A/D units, in which 100 units ≈ 79 μV); the maximum ratio ofTh/De is 2.4. Time lines indicate the baseline periods corresponding to 30 min pre- and postinjection recording periods.PS, Paradoxical sleep; SWS, slow wave sleep; tPS, transition into paradoxical sleep;tSWS, transition into slow wave sleep.
Fig. 3.
Fig. 3.
Average percentage of state and EEG and EMG activities from baseline recording during the 30 min afternoon (equivalent postinjection) recording period (see Fig. 2), demonstrating the amounts of each state and the associated changes in EEG and EMG activities. The % State reflects the relative amounts of time spent in each state; Ga and Deare frequency band activities, Th/De is the ratio of band activities, and EMG is the total spectral activity across sleep–wake states (EEG activities are taken from the right retrosplenial lead and are reported together with EMG as amplitude in A/D units, in which 100 units ≈ 79 μV, or are reported as a ratio). Data are presented as mean ± SEM for eight rats.Ga, De, Th/De, andEMG all varied significantly as a function of state (repeated measures ANOVA with df = 4, 24; p ≤ 0.05).
Fig. 4.
Fig. 4.
Hypnogram and EEG and EMG activities (per 20 sec epoch) during Ringer’s pre- and postinjection recording periods (rat B10). After the preinjection recording period, the filled inner cannulae were inserted in the guide cannulae (see Fig. 1), and the animal was allowed to resume sleeping before recording was reinitiated. With the appearance of a normal sleep cycle, marked by SWS andtPS, leading to PS, the cannulae were lowered via remote control into the basal forebrain (see Fig. 1); the bilateral injection was started ∼2 min later and was performed over ∼5 min. The postinjection recording period was defined as the 30 min period after the injection was stopped (time, 0–30 min at right). Note the minimal disturbance to the sleep–wake cycle caused by the injection procedure and the injection of Ringer’s. EEG frequency band activity is from the right retrosplenial lead and, together with EMG, is displayed as amplitude units or as a ratio scaled to maximum activity. In this figure, the maximum amplitude for Gais 180, for De is 360, and for EMG is 475 (A/D units, in which 100 units ≈ 79 μV); the maximumTh/De ratio is 2.2.
Fig. 5.
Fig. 5.
Hypnogram and EEG and EMG activities (per 20 sec epoch) during noradrenaline pre- and postinjection recording periods (rat B10). Note the immediate occurrence of wake once the filled cannulae are inserted and the maintenance of a wake state in association with moderately high γ-EEG activity and low δ-EEG activity during the entire postinjection period. BothTh/De and EMG remain relatively high. EEG frequency band activity is from the right retrosplenial lead and, together with EMG, is displayed as amplitude units or as a ratio scaled to maximum activity. In this figure, the maximum amplitude forGa is 155, for De is 395, and forEMG is 550 (A/D units, in which 100 units ≈ 79 μV); the maximum Th/De ratio is 2.3.
Fig. 6.
Fig. 6.
Hypnogram and EEG and EMG activities (per 20 sec epoch) during serotonin pre- and postinjection recording periods (rat B20). Note the continuity of SWS during and after the injection in association with a decrease in γ activity and the persistence of δ activity. No PS occurs in the postinjection period, andTh/De ratio remains low. Moderate EMG activity is present. The EEG frequency band activity is from the right retrosplenial lead and, together with EMG, is displayed as amplitude units or as a ratio scaled to maximum activity. In this figure, the maximum amplitude for Ga is 156, for Deis 380, and for EMG is 800 (A/D units, in which 100 units ≈ 79 μV); the maximum Th/De ratio is 3.6.
Fig. 7.
Fig. 7.
Percentage of time spent in sleep–wake states during Ringer’s (R), noradrenaline (NA), and serotonin (5-HT) postinjection periods. Values are mean ± SEM forR, n = 8; for NA,n = 5; and for 5-HT,n = 8. *Significantly different from Ringer’s, according to paired comparison t tests (p ≤ 0.05).
Fig. 8.
Fig. 8.
Average EEG and EMG activities during postinjection recording periods after Ringer’s (R), noradrenaline (NA), and serotonin (5-HT) microinjections. For EEG (from right retrosplenial lead), Ga and De are expressed as absolute activities in each frequency band (reported as amplitude in A/D units, in which 100 units ≈ 79 μV),Th/De as the ratio of absolute activities in each band, and EMG also as an absolute activity. Data are presented as mean ± SEM for R, n = 8; for NA, n = 5; for5-HT, n = 8. *Significantly different from Ringer’s, according to paired comparisont tests (p ≤ 0.05).
Fig. 9.
Fig. 9.
EEG samples from noradrenaline and serotonin postinjection recording periods. Shown are unfiltered (top) and high-frequency γ (30.5–58.0 Hz) filtered (bottom) EEG samples (2 sec each) illustrating EEG patterns that occurred during the respective postinjection recording periods. Noradrenaline produced a low-voltage fast EEG pattern (top) in association with relatively high γ activity (bottom), similar to normal wake (rat B10), whereas serotonin produced a high-voltage slow EEG pattern (top) in association with relatively low γ activity (bottom), similar to normal SWS (rat B20). The samples were taken ∼2–3 min after the injection was stopped. The EEG was recorded by reference to an electrode in the rostral frontal bone from the left and right frontal (LF andRF), retrosplenial (LRS andRRS), parietal (LP andRP), and occipital (RO) cortical regions. Voltage scales are the same for all cortical leads.
Fig. 10.
Fig. 10.
Average spectra from epochs after the injection of noradrenaline (rat B10) and serotonin (rat B20). After noradrenaline, a small low-frequency peak is in the θ range, and the overall amplitude in the γ range is relatively high. After serotonin, a prominent peak is evident in the δ band, and a relatively low overall amplitude is evident in the γ band. The spectra were computed from five 4 sec EEG segments from the right retrosplenial lead that were each 1 min apart and occurred within ∼2–8 min after the injection. Spectra are displayed in amplitude (A/D units, in which 100 ≈ 79 μV) per 0.5 Hz shown at different scales for the low-frequency range (1.5–18.5 Hz) and the high-frequency range (19.0–58.0 Hz) to maximize the appearance of potential peaks in each range. δ, θ, and γ frequency bands, which were used for calculating total activity per band (see Figs. 2-6, 8, 11), areshaded differentially.
Fig. 11.
Fig. 11.
Dose–response relationships showing the effect of increasing doses of noradrenaline and serotonin on average EEG frequency band activity during the postinjection period (see Fig. 8). Least-squares means plots are presented from the output of ANCOVAs (with dose as the main factor and rat as the covariate). EEG activities are taken from the right retrosplenial lead and reported as amplitude in A/D units, in which 100 units ≈ 79 μV, or are reported as a ratio. Dose indicates total nanomoles of drug injected on each side, and 0 corresponds to Ringer’s. *Significant main effect of dose for NA(n = 4) or 5-HT(n = 3) (ANCOVA, df = 4, 1;p ≤ 0.05).

Similar articles

Cited by

References

    1. Aghajanian GK, Wang RY, Barban J. Serotonergic and non-serotonergic neurons of the dorsal raphe: reciprocal changes in firing induced by peripheral nerve stimulation. Brain Res. 1978;153:169–175. - PubMed
    1. Aston-Jones G, Bloom FE. Activity of norepinephrine-containing locus coeruleus neurons in behaving rats anticipates fluctuations in the sleep–waking cycle. J Neurosci. 1981a;1:876–886. - PMC - PubMed
    1. Aston-Jones G, Bloom FE. Norepinephrine-containing locus coeruleus neurons in behaving rats exhibit pronounced responses to non-noxious environmental stimuli. J Neurosci. 1981b;1:887–900. - PMC - PubMed
    1. Berridge CW, Foote SL. Effects of locus coeruleus activation on electroencephalographic activity in neocortex and hippocampus. J Neurosci. 1991;11:3135–3145. - PMC - PubMed
    1. Buzsáki G, Bickford RG, Ponomareff G, Thal LJ, Mandel R, Gage FH. Nucleus basalis and thalamic control of neocortical activity in the freely moving rat. J Neurosci. 1988;8:4007–4026. - PMC - PubMed

Publication types

MeSH terms

LinkOut - more resources