. 1998 Apr 1;18(7):2764-76.
doi: 10.1523/JNEUROSCI.18-07-02764.1998.

Age-related alteration in processing of temporal sound features in the auditory midbrain of the CBA mouse

Affiliations

Age-related alteration in processing of temporal sound features in the auditory midbrain of the CBA mouse

J P Walton et al. J Neurosci. .

Abstract

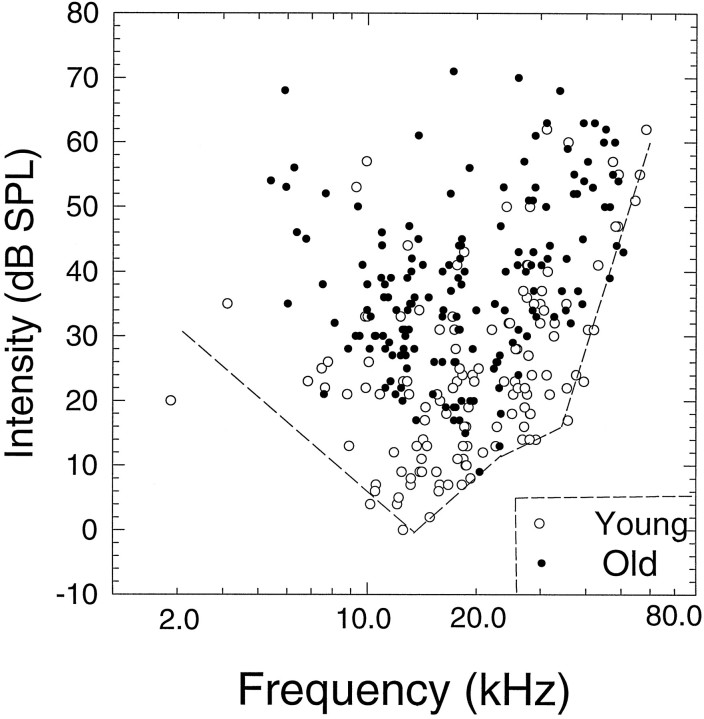
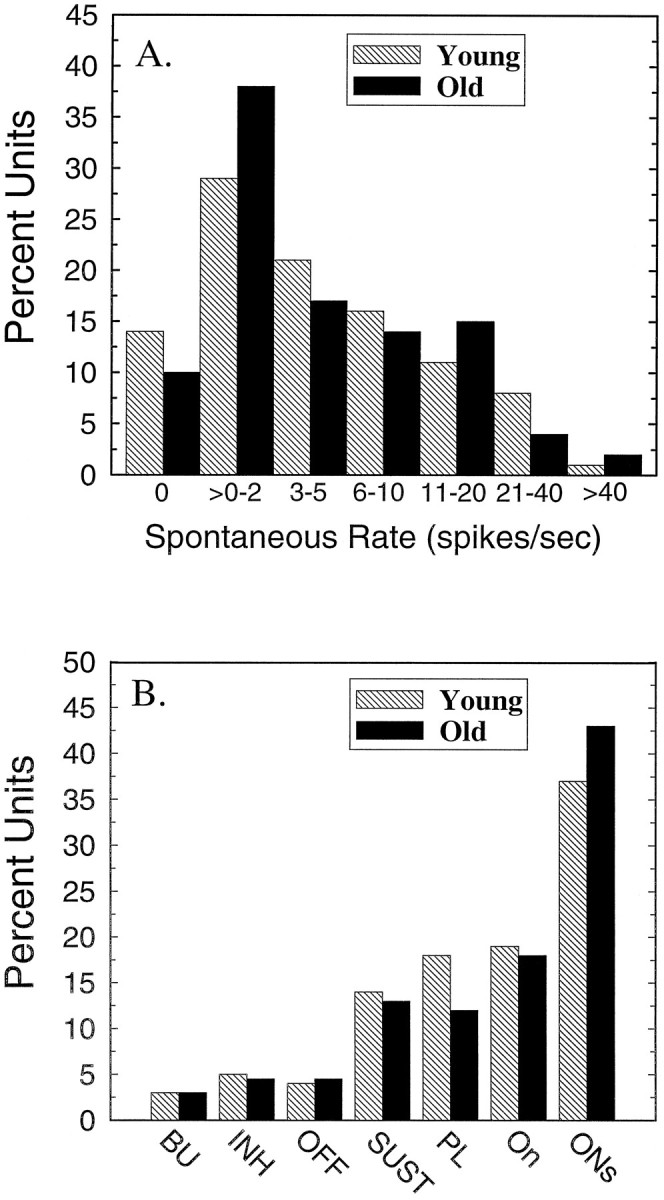
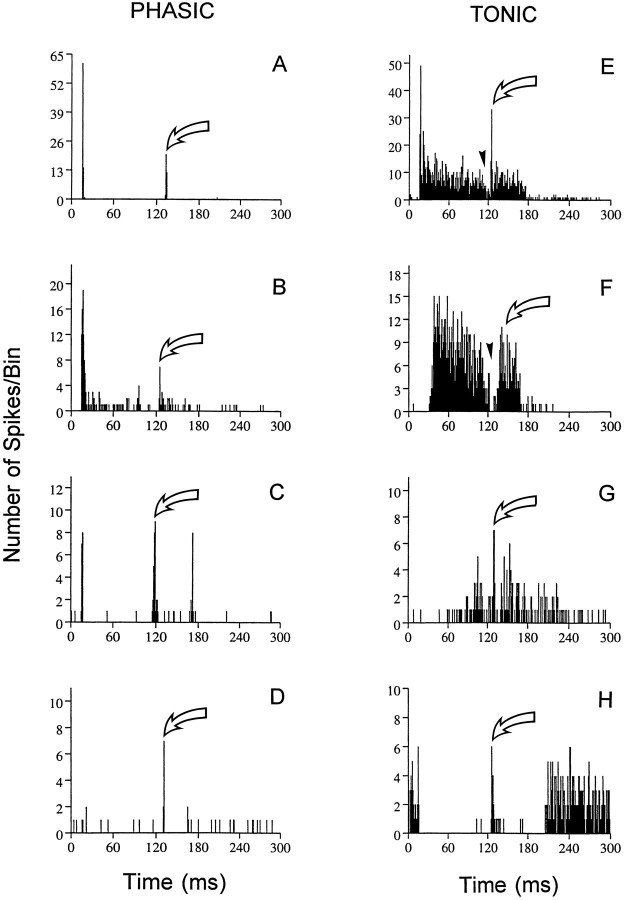
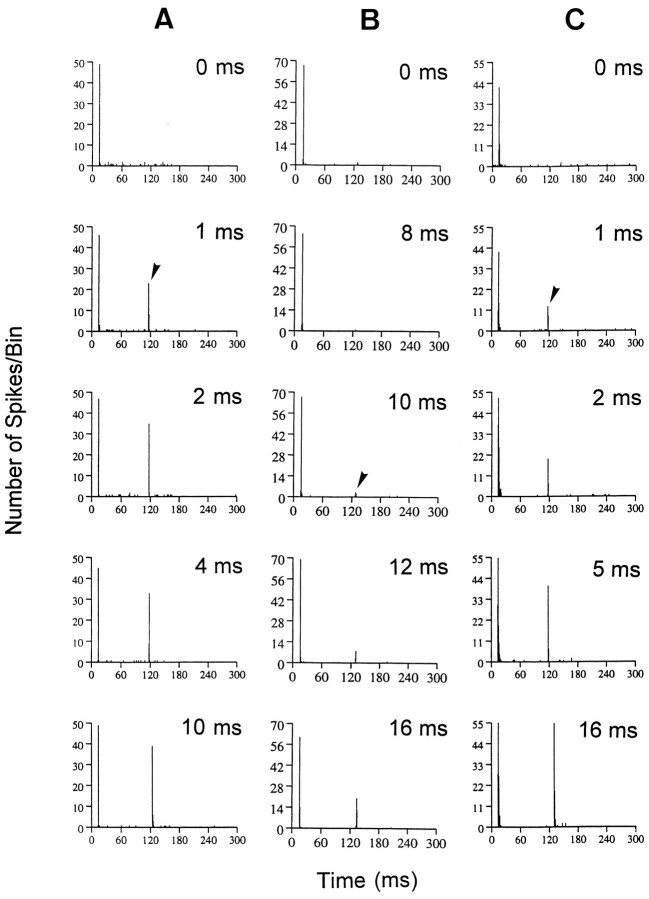
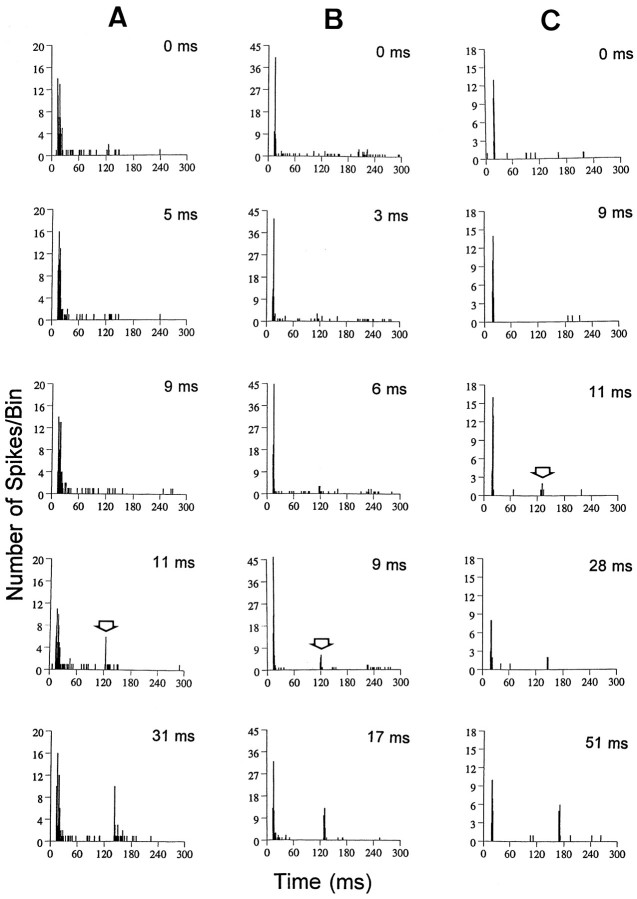
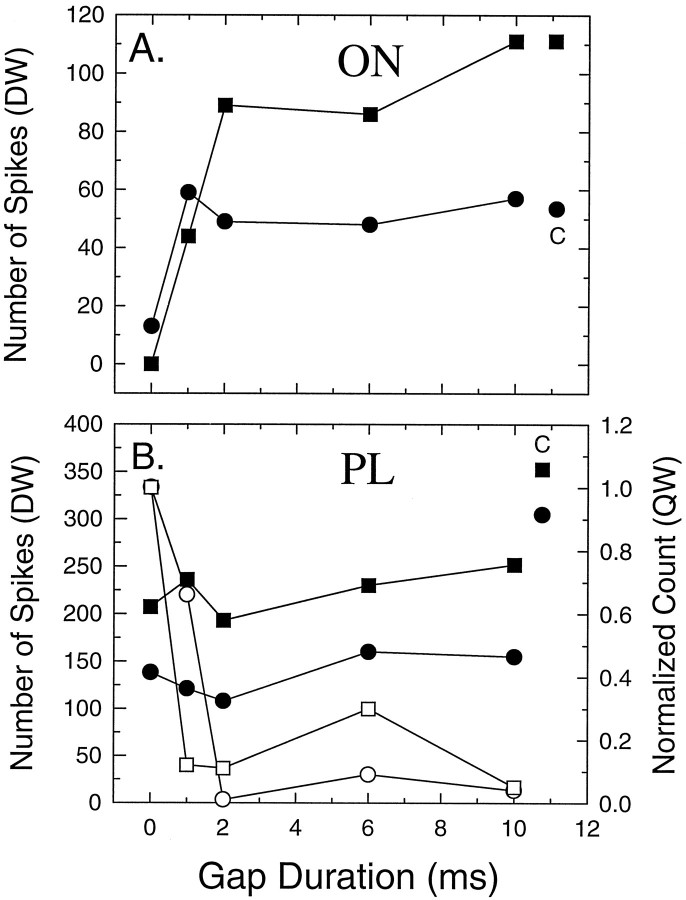
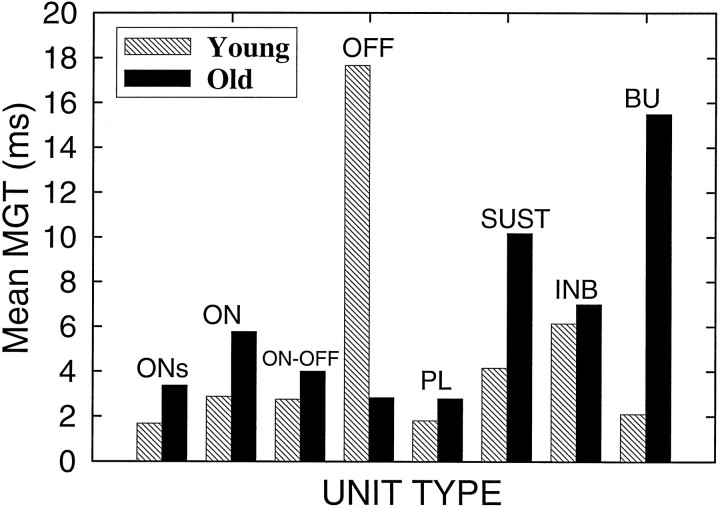
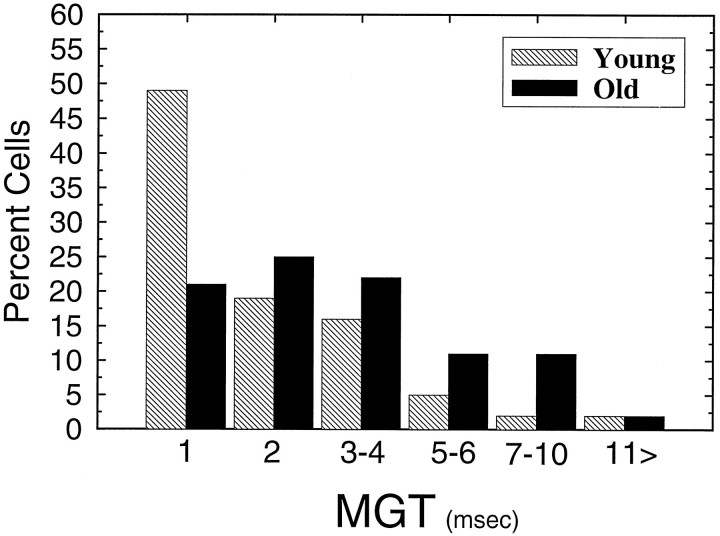
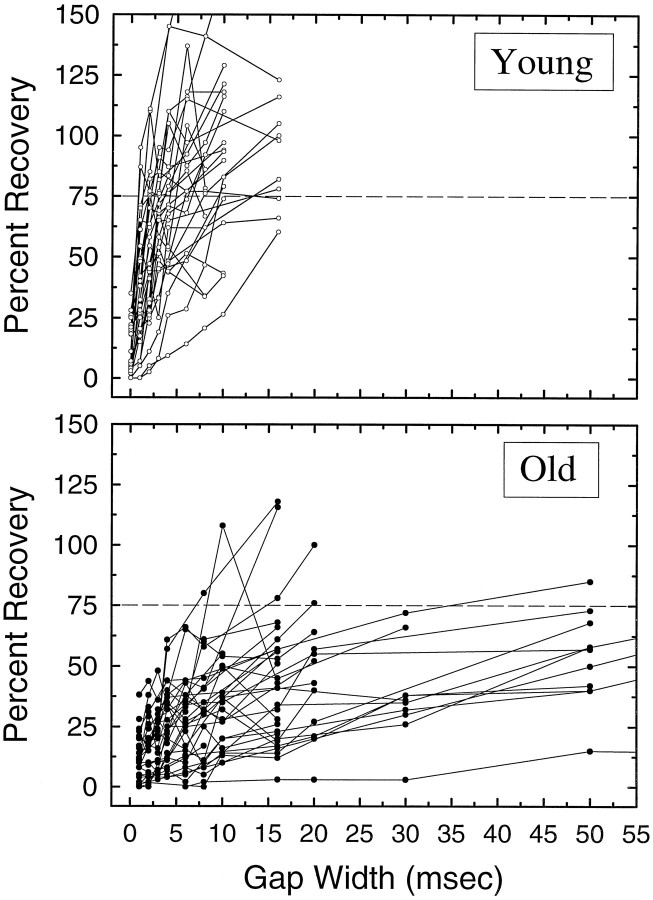
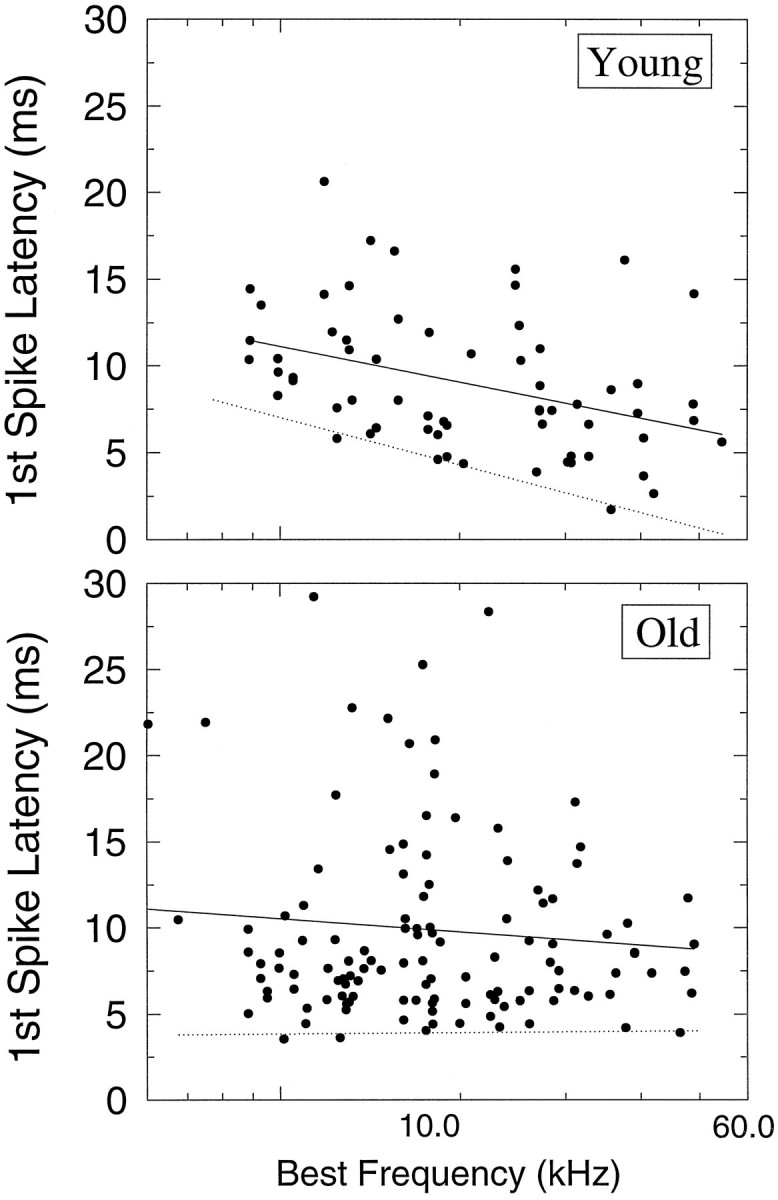
The perception of complex sounds, such as speech and animal vocalizations, requires the central auditory system to analyze rapid, ongoing fluctuations in sound frequency and intensity. A decline in temporal acuity has been identified as one component of age-related hearing loss. The detection of short, silent gaps is thought to reflect an important fundamental dimension of temporal resolution. In this study we compared the neural response elicited by silent gaps imbedded in noise of single neurons in the inferior colliculus (IC) of young and old CBA mice. IC neurons were classified by their temporal discharge patterns. Phasic units, which accounted for the majority of response types encountered, tended to have the shortest minimal gap thresholds (MGTs), regardless of age. We report three age-related changes in neural processing of silent gaps. First, although the shortest MGTs (1-2 msec) were observed in phasic units from both young and old animals, the number of neurons exhibiting the shortest MGTs was much lower in old mice, regardless of the presentation level. Second, in the majority of phasic units, recovery of response to the stimulus after the silent gap was of a lower magnitude and much slower in units from old mice. Finally, the neuronal map representing response latency versus best frequency was found to be altered in the old IC. These results demonstrate a central auditory system correlate for age-related decline in temporal processing at the level of the auditory midbrain.


Figures

Fig. 1.
Fig. 1.
Distribution of BFs and thresholds for IC units in young (n = 127, open circles) and old (n = 147, filled circles) CBA mice. The dashed line represents the best fit (by eye) to the best thresholds of the young units. Although the range of BFs is similar for the two age groups, there is a clear difference of ∼20–30 dB between the best thresholds of the two ages.
Fig. 2.
Fig. 2.
Spontaneous rates and the proportion of different temporal response patterns remains stable with age. A, Distribution of units with spontaneous rates from 0 to >40 spikes/sec from old animals (n = 147, filled bars) and young animals (n = 127,hatched bars). B, Distribution of units encountered in young (hatched bars) and old (filled bars) animals having temporal discharge patterns that corresponded to unit classifications of the present study.
Fig. 3.
Fig. 3.
Neural encoding of silent gaps varied depending on the temporal response pattern of a unit. Examples of PSTHs to the gap stimulus from the eight response types encountered in the young and old CBA inferior colliculus. All examples were taken from old animals ranging in age from 24 to 28 months [except for the inhibitory unit (H) taken from a 3-month-old CBA mouse]. Additional examples of PSTHs to gaps from young animals can be found in an article by Walton et al. (1997). Phasic units include the on (A), on-sustained (B), ON–OFF (C), and OFF (D), and tonic units include primary-like (E), sustained (F), buildup (G), and inhibitory (H). The intensity of the gap stimulus was 65 dB SPL, and the silent gap was preceded by NB1 of 100 msec and followed by NB2 of 50 msec. The neural response to the gap (large arrows) varied for the different temporal response patterns. Above MGT all phasic neurons responded synchronously to both the onset of NB1 and NB2. Most tonic units fell into the PL and SUST classes, and the gap was encoded by sustained activity throughout the duration of NB1 and NB2, with complete cessation of activity at long gap durations (arrowheads). BFs for the eight units ranged from 8.5 to 33 kHz, and the noise threshold ranged from 32 to 45 dB.
Fig. 4.
Fig. 4.
PSTHs showing the typical age effect on neural responses to gaps for three different ON units. The top row in each column shows control (0 msec gap) responses.A, PSTHs from a gap series recorded from an ON unit in a young animal (BF, 19.1 kHz; threshold, 28 dB SPL). The unit inB is representative of those units encountered in old CBA mice (BF, 13.5 kHz; threshold, 22 dB SPL). The unit responded poorly to gaps, had an elevated gap threshold (MGT, 10 msec), and prolonged recovery to NB2. Note that the NB2 response to the 16 msec gap is substantially <50% of the response to NB1. In contrast,C shows a unit from an old animal that responds very much like the unit from the young animal (A), having an MGT (arrowhead) of 1 msec and a relatively strong gap response at all gap durations (BF, 14.5 kHz; threshold, 36 dB SPL).
Fig. 5.
Fig. 5.
Additional examples of gap series from three ONs units recorded from a 24-month-old CBA mouse, all displaying very poor gap-encoding ability. Gap thresholds, denoted by thearrowheads, ranged from 6 to 11 msec. Note that all three units displayed very long recovery times, when the NB2 response is compared with the NB1 response at each gap width. Recovery strength was only 22% for the 31 msec gap for the unit in A (BF, 9.8 kHz; threshold, 30 dB SPL), 43% for the 17 msec gap width for the unit in B (BF, 31.3 kHz; threshold, 38 dB SPL), and 53% for the 51 msec gap duration for the unit in C (BF, 23.8 kHz; threshold, 34 dB SPL).
Fig. 6.
Fig. 6.
Magnitude of the neural response varies with increases in gap duration for different unit types. A, Two different ON units in which the number of spikes elicited by the onset of NB2 in the driven window is plotted against gap duration. The driven window was adjusted to include all of the discharges evoked by NB2. The spike count elicited by NB1 (control response) is shown to theright (A) and (B) denoted by the letter C. The 0 msec spike count represents the driven activity measured when a gap would have been present in the control (150 msec) stimulus. Note that the spike count rapidly increases in ON units for gap durations >1 msec and then saturates. B, Gap functions from two PL units in which spike counts were measured in both a driven window of 50 msec (filled symbols, left axis) and a quiet window set to equal the duration of the gap (open symbols, right axis). A normalized spike count of 1.0 would occur when the spike count in the control PSTH equaled the count during the gap. The nonselective profile of the driven window gap function is caused by the relatively large number of spikes in the control histogram (filled symbols), which sets the baseline from which the neuron can signal a stimulus-related change by a change in discharge rate. Spikes measured in the quiet window of PL units are shown to change rapidly as the gap duration increases.
Fig. 7.
Fig. 7.
Frequency distribution of mean MGTs plotted as a function of response type for the 108 gap series of units from young animals and 131 series from old animals. Note that the mean MGTs are generally longer for units from the old animals compared with young, regardless of response type (except for the OFF class). The total numbers of units in which gap series were obtained in both young and old mice were ONs, n = 107; ON,n = 31; ON–OFF, n = 15; OFF,n = 17; PL, n = 20; SUST,n = 31; INH, n = 13; and BU,n = 5.
Fig. 8.
Fig. 8.
Proportion of units having MGTs ranging from 1 to >11 msec for the young (hatched bars,n = 78) and old (filled bars,n = 108) mice. Note that the distribution favors considerably higher gap thresholds for the units from old animals.
Fig. 9.
Fig. 9.
Neural recovery functions plotted for 30 phasic units (ON and ONs types only) in young (top panel) and old (bottom panel) animals. Neural recovery was quantified by computing the number of spikes elicited by NB2 divided by the spike count to NB1 × 100. This was done for every histogram in the gap series. A recovery value of 100% would represent equal discharges to both NB1 and NB2.Dashed horizontal lines represent 75% recovery. Recovery to the 75% criterion is complete by ≤10–15 msec in nearly every neuron from the young animals, whereas most neurons from old animals do not reach this criterion for any of the gap durations tested. Note also that many neurons from young animals show facilitation; e.g., the response to NB2 is greater than NB1 for certain gap durations.
Fig. 10.
Fig. 10.
Mean first spike latency distributions and regression analyses plotted as a function of BF for young (top) and old (bottom) units. All response latency measures were derived from noise bursts presented at 65 dB SPL. To measure only spikes evoked by the signal, the analysis period was restricted to the first 25 msec after response onset, as measured from the PSTHs of a unit, for phasic units (ON, ONs, and ON–OFF) and 50 msec for tonic units (PL and SUST). Response latencies ranged from 3 to 22 msec in the young distribution and from 3.3 to 28 msec in the old distribution. Acoustic delays were subtracted from the raw latency values using a linear regression used to fit the data (solid line). The dotted line (fit by eye) highlights the gradient of shortest first spike latencies in both young and old distributions.

References

    1. Adams JC. Ascending connections to the inferior colliculus. J Comp Neurol. 1979;183:519–538. - PubMed
    1. Aitkin L. The auditory brainstem. Integration and conclusions (Ottoson D, ed), pp 128–209. Springer; Berlin: 1986.
    1. Aitkin L, Tran L, Syka J. The responses of neurons in subdivisions of the inferior colliculus of cats to tonal, noise and vocal stimuli. Exp Brain Res. 1994;98:53–64. - PubMed
    1. Baimbridge KG, Celio MR, Roger JH. Calcium-binding proteins in the nervous system. Trends Neurosci. 1992;15:303–307. - PubMed
    1. Barsz K, Benson PK, Walton JP. Gap encoding by inferior collicular neurons is altered by minimal changes in signal envelope. Hear Res. 1998;115:13–26. - PubMed

Publication types