. 1998 Feb 1;506 ( Pt 3)(Pt 3):609-25.
doi: 10.1111/j.1469-7793.1998.609bv.x.

Zn2+ inhibition of recombinant GABAA receptors: an allosteric, state-dependent mechanism determined by the gamma-subunit

Affiliations

Zn2+ inhibition of recombinant GABAA receptors: an allosteric, state-dependent mechanism determined by the gamma-subunit

K J Gingrich et al. J Physiol. .

Abstract

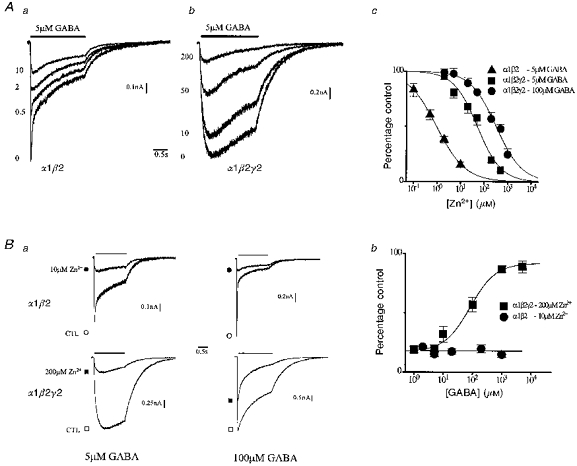
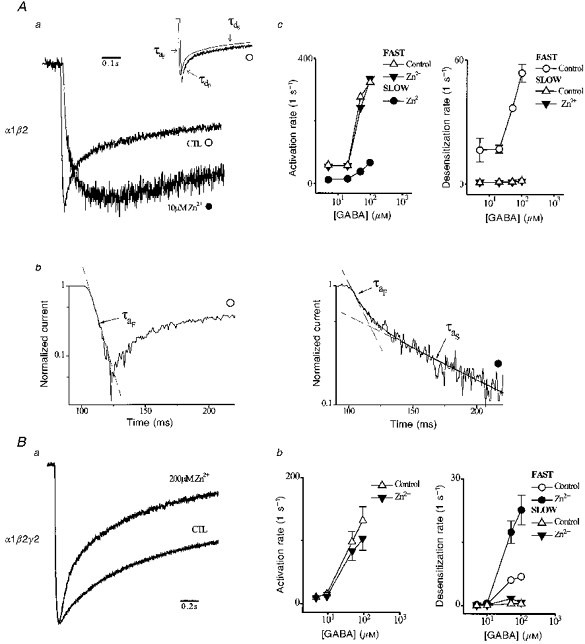
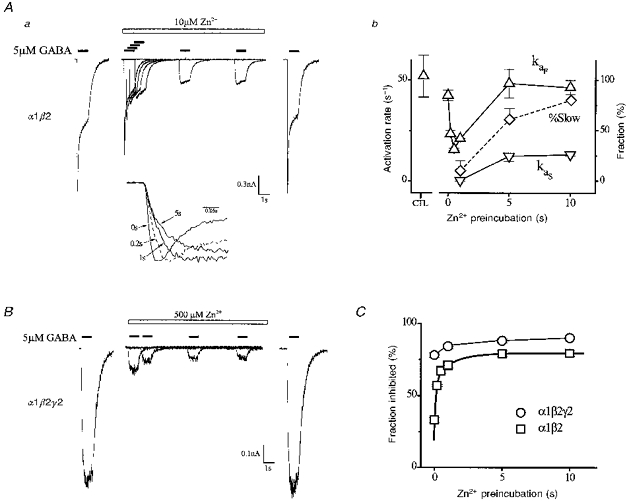
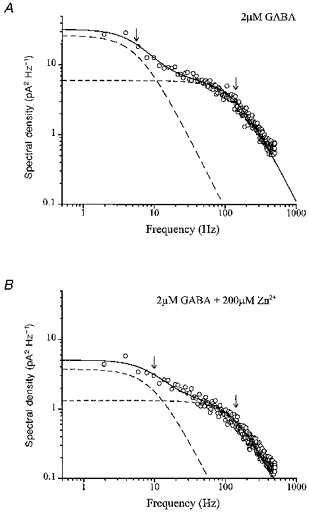
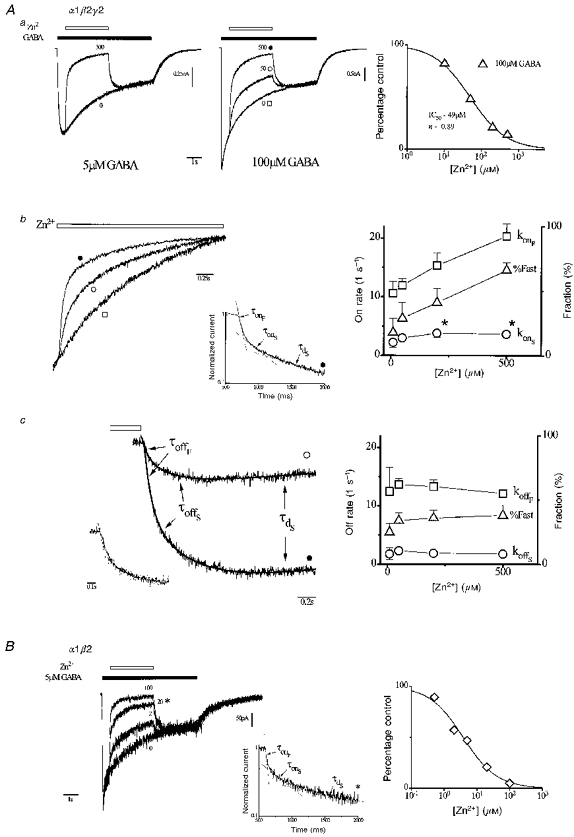
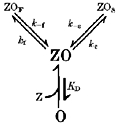
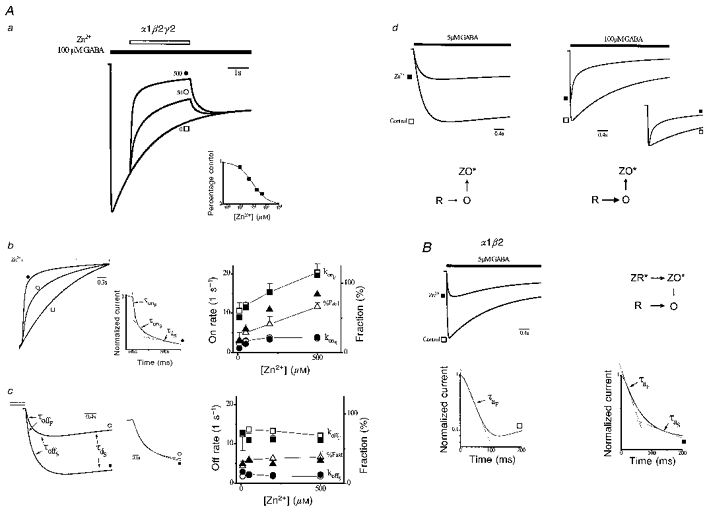
1. The gamma-subunit in recombinant gamma-aminobutyric acid (GABAA) receptors reduces the sensitivity of GABA-triggered Cl- currents to inhibition by Zn2+ and transforms the apparent mechanism of antagonism from non-competitive to competitive. To investigate underlying receptor function we studied Zn2- effects on macroscopic and single-channel currents of recombinant alpha 1 beta 2 and alpha 1 beta 2 gamma 2 receptors expressed heterologously in HEK-293 cells using the patch-clamp technique and rapid solution changes. 2. Zn2+ present for > 60 s (constant) inhibited peak, GABA (5 microM)-triggered currents of alpha 1 beta 2 receptors in a concentration-dependent manner (inhibition equation parameters: concentration at half-amplitude (IC50) = 0.94 microM; slope related to Hill coefficient, S = 0.7) that was unaffected by GABA concentration. The gamma 2 subunit (alpha 1 beta 2 gamma 2 receptor) reduced Zn2+ sensitivity more than fiftyfold (IC50 = 51 microM, S = 0.86); increased GABA concentration (100 microM) antagonized inhibition by reducing apparent affinity (IC50 = 322 microM, S = 0.79). Zn2+ slowed macroscopic gating of alpha 1 beta 2 receptors by inducing a novel slow exponential component in the activation time course and suppressing a fast component of control desensitization. For alpha 1 beta 2 gamma 2 receptors, Zn2+ accelerated a fast component of apparent desensitization. 3. Zn2+ preincubations lasting up to 10 s markedly increased current depression and activation slowing of alpha 1 beta 2 receptors, but had little effect on currents from alpha 1 beta 2 gamma 2 receptors. 4. Steady-state fluctuation analysis of macroscopic alpha 1 beta 2 gamma 2 currents (n = 5) resulted in control (2 microM GABA) power density spectra that were fitted by a sum of two Lorentzian functions (relaxation times: 37 +/- 5.6 and 1.41 +/- 0.15 ms, means +/- S.E.M.). Zn2+ (200 microM) reduced the total power almost sixfold and accelerated the slow (23 +/- 2.8 ms, P < 0.05) without altering the fast (1.40 +/- 0.16 ms) relaxation time. The ratio (fast/slow) of Lorentzian areas was increased by Zn2+ (control, 3.39 +/- 0.55; Zn2+, 4.9 +/- 0.37, P < 0.05). 5. Zn2+ (500 microM) depression of previously activated current amplitudes (% control) for alpha 1 beta 2 gamma 2 receptors was independent of GABA concentration (5 microM, 13.2 +/- 0.72%; 100 microM, 12.2 +/- 2.9%, P < 0.8, n = 5). Both onset and offset inhibition time courses were biexponential. Onset rates were enhanced by Zn2+ concentration. Inhibition onset was also biexponential for preactivated alpha 1 beta 2 receptors with current depression more than fourfold less sensitive (5 microM GABA, IC50 = 3.8 microM, S = 0.84) relative to that in constant Zn2+. 6. The results lead us to propose a general model of Zn2+ inhibition of GABAA receptors in which Zn2+ binds to a single extracellular site, induces allosteric receptor inhibition involving two non-conducting states, site affinity is state-dependent, and the features of state dependence are determined by the gamma-subunit.


Figures

Figure 1
Figure 1. Zn2+ inhibition of peak current
Aa and b, macroscopic currents triggered by GABA (5 μM, filled bar) in the presence of a range of Zn2+ concentrations (in μM; left of trace) for individual cells expressing α1β2 and α1β2γ2 subunits. Downward current deflection reflects receptor opening. GABA was applied using rapid solution changes. c, inhibition curves were constructed by plotting peak current as percentage of control versus Zn2+ concentration (generally n= 6). Smooth curves are least-squares fits of the inhibition equation (see Methods). Fitted parameters are: α1β2 (5 μM GABA), IC50= 0.94 μM, S= 0.70; α1β2γ2 (5 μM GABA), IC50= 51 μM, S= 0.86; α1β2γ2 (100 μM GABA), IC50= 322 μM, S= 0.79. Ba, currents triggered by application (bars) of different GABA concentrations in the absence (CTL, open symbols) and presence (filled symbols) of Zn2+ concentrations from individual cells expressing indicated receptors. b, peak current (percentage of control) concentration-response relationships for GABA at a fixed Zn2+ concentration (n= 5). Continuous lines were drawn by hand.
Figure 2
Figure 2. Zn2+ effects on macroscopic gating
Aa, normalized α1β2 responses (5 μM GABA) replotted from Fig. 1B to illustrate the effects of Zn2+ on macroscopic current kinetics. Zn2+ response was rightward shifted to permit clear observation of activation time course. Inset, plot of control response and triexponential function fit (smooth line, shifted for clarity). Exponential components are indicated by their respective time constants (fast activation, τaF; fast, τdF, and slow, τdS densensitization). Time constants (τ) are the reciprocal of associated rates (k). Fitted parameters are: AaF= 1.2 nA, kaF= 108 s−1, AdF= -0.81 nA, kdF= 33.3 s−1, AdS= -0.33 nA, kdS= 2.48 s−1, B = -0.42 nA. Ac, GABA concentration dependence of activation and desensitization rates from fitted triexponential functions (generally n= 5 cells). Ab, semilogarithmic plots of currents normalized to peak current. Control (○) activation is described by a single fast exponential (dashed line, time constant, τaF). Zn2+ (•) adds a second slow exponential component to activation (time constant, τaS). The sum of these exponentials (continuous line) describes the activation time course. Ba, normalized α1β2γ2 responses (100 μM GABA) replotted from Fig. 1B to illustrate the effects of Zn2+ on macroscopic current kinetics. Bb, GABA concentration dependence of activation and desensitization rates from fitted triexponential functions (generally n= 5 cells).
Figure 3
Figure 3. Effects of Zn2+ preincubation on current magnitude and kinetics
Aa, currents triggered by GABA (5 μM, filled bars) from a single cell expressing α1β2 receptors with differing periods of Zn2+ preincubation. An initial control response is displayed on the extreme left. Shown next on the same baseline are responses over a range of Zn2+ preincubation periods (time difference between Zn2+ (10 μM, open bar) and GABA applications). A final bracketing control response is shown on the extreme right. Inset shows four normalized responses aligned in time on an expanded time scale with indicated preincubation periods. Ab, plots of activation parameters derived from multiexponential fitting. Plotted parameters include fast (kaF) and slow (kaS) activation rates, and fraction of activation time course that is slow (% Slow). B, same protocol as in Aa applied to a single cell expressing α1β2γ2 receptors (5 μM GABA, 500 μM Zn2+). C, fractional inhibition of current magnitude versus Zn2+ preincubation in cells expressing α1β2 and α1β2γ2 receptors as indicated (n= 3-7 cells). Thick smooth curve is a biexponential function fit of α1β2 response (parameters: AF= -0.31, kF= 6.7 s−1, AS= -0.17, kS= 0.72 s−1, and B = 0.79).
Figure 4
Figure 4. Zn2+ effects on macroscopic current fluctuations of α1β2γ2 receptor
A, power density spectrum of steady-state macroscopic current activated by 2 μM GABA from a single cell expressing α1β2γ2 subunits. Smooth continuous curve represents the sum of two individual Lorentzian functions (dashed lines) with corner frequencies of 5.8 and 137 Hz (arrows). B, power density spectrum of steady-state macroscopic current activated by 2 μM GABA in the presence of 200 μM Zn2+ from the same cell. Corner frequencies are 9.6 and 136 Hz (arrows).
Figure 5
Figure 5. Zn2+ inhibition of currents previously activated by GABA
Aa, left panel, current response to Zn2+ application (500 μM, 3 s, open bar) from a cell expressing α1β2γ2 receptors preactivated by low [GABA] (5 μM, filled bar). Zn2+ concentrations (in μM) are given adjacent to responses. Inhibition is determined at the end of the Zn2+ application. Middle panel, same protocol and cell at higher GABA concentration (100 μM) and over a range of Zn2+ concentrations. Vertical scaling was adjusted to nearly normalize current magnitude at the start of Zn2+ application. Right panel, current in Zn2+, as percentage of control, versus Zn2+ concentration at indicated GABA concentration (n= 5). The smooth curve is a fit of the inhibition equation (IC50= 49 μM, S= 0.89). Ab, left, time courses of inhibition onset, normalized and replotted from Aa (symbols identify responses). Inset, onset time course normalized to unity and plotted on semilogarithmic axes (500 μM Zn2+). Time course is well fitted by a triexponential function (smooth line; parameters: AonF= 0.38, konF= 21 s−1, AonS= 0.15, konS= 6.5 s−1, AdS= 0.32, kdS= 1.01 s−1, B = 0.05). The periods dominated by each exponential component are indicated by dashed lines labelled with associated time constants (reciprocal of respective rates: fast (τonF) and slow (τonS) inhibition onset and slow desensitization (τdS)). Right, concentration-response relationships for onset parameters derived from triexponential fitting (fast (konF) and slow (konS) onset rates, and fraction of onset that is fast [ % Fast = 100AonF/(AonF+ AonS)]). Asterisks mark konSs that are significantly different (P < 0.05, paired t test) from low Zn2+ (10 μM). Ac, time courses of inhibition recovery or offset replotted from Aa (symbols identify traces), shifted in magnitude to align current magnitude at the end of the Zn2+ application (open bar). Smooth lines are triexponential function fits (parameters are: 50 μM Zn2+, AoffF= 0.19 nA, koffF= 15.4 s−1, AoffS= 0.36 nA, koffS= 2.9 s−1, AdS= -0.32 nA, kdS= 0.47 s−1, B = -1.26 nA; 500 μM Zn2+, AoffF= 0.60 nA, koffF= 12.2 s−1, AoffS= 0.63 nA, koffS= 1.58 s−1, AdS= -0.93 nA, kdS= 0.61 s−1, B = -1.20 nA). Exponential components are labelled by associated time constants (reciprocal of respective rates: fast (τoffF) and slow (τoffS) inhibition onset and slow desensitization (τdS)). Inset, normalized offset time courses replotted on an expanded timescale (interrupted line, 50 μM Zn2+; thick line, 500 μM Zn2+). Right, concentration-response relationships for offset parameters (fast (koffF) and slow (konS) offset rates, and fraction of offset that is fast (% Fast)) (generally n= 5). B, left, same protocol as in Aa applied to a cell expressing α1β2 receptors. Inset, onset time course normalized to unity and plotted on semilogarithmic axes (20 μM Zn2+). As with α1β2γ2 receptors, time course is triexponential where each exponential component is indicated and labelled as in Ab. Right, current magnitude (% of control) versus Zn2+ concentration (generally n= 5) and fitted by inhibition equation (smooth curve, IC50= 3.8 μM, S= 0.84).
Scheme 1
Scheme 1
Scheme 2
Scheme 2
Figure 6
Figure 6. Responses from gating models
Aa, responses from α1β2γ2 gating model (see text) to Zn2+ application (open bar, concentrations adjacent to response in μM) of currents preactivated by GABA (filled bar). Inset, current in Zn2+, as percentage of control, versus Zn2+ concentration and the fit by the inhibition equation (smooth curve, IC50= 94 μM, S= 0.77). Ab, left, normalized time courses of inhibition onset replotted from Aa (symbols identify responses). Middle, onset time course normalized to unity and plotted on semilogarithmic axes (500 μM Zn2+). Time course is triexponential with each component indicated by dashed straight lines labelled with associated time constants (reciprocal of respective rates: fast (τonF) and slow (τonS) inhibition onset and slow desensitization (τdS)). Superimposed line is fitted by a triexponential function (parameters: AonF= 0.47, konF= 18 s−1, AonS= 0.16, konS= 2.5 s−1, AdS= 0.17, kdS= 0.22 s−1, B = 0.04). Right, concentration- response relationships for fitted parameters from gating model (filled symbols) and empirical responses replotted from Fig. 5Ab (open symbols). Ac, time courses of inhibition offset replotted from Aa, shifted in magnitude to align currents at the end of the Zn2+ application (open bar). Time courses are well fitted by a triexponential with each component labelled by the associated time constant (reciprocal of respective rates: fast (τoffF) and slow (τoffS) inhibition onset and slow desensitization (τdS)). Middle, normalized offset time courses replotted on an expanded time scale. Right, concentration-response relationships for offset parameters from gating model (filled symbols) and empirical responses replotted from Fig. 5Ac (open symbols). Ad, α1β2γ2 model responses triggered at low (5 μM) and high (100 μM) GABA concentrations (bar) in control (□) and in constant Zn2+ (300 μM, ▪) with vertical scaling adjusted to normalize for peak control currents. Dominant model gating pathways are shown below responses where rate magnitudes are related to the emboldening and length of transition arrows and ZX* represents Zn2+-bound states (ZX, ZXS and ZXF) associated with state X (X = R, O, or D). B, α1β2 model responses at 5 μM GABA (bar) in control (□) and in the presence of Zn2+ (10 μM, ▪) with dominant model gating pathways shown adjacently. Below, semilogarithmic plot of onset time courses from above normalized to peak current magnitude. In control, activation is described by a single fast exponential (dashed line, time constant, τaF). Zn2+ adds a second slow exponential component to activation (time constant, τaS). The sum of the fitted triexponentials (superimposed line; AonF= 0.31, konF= 19 s−1, AonS= 0.11, konS= 3.4 s−1, AdS= -0.31, kdS= 0.54 s−1, B = 0.87) describes the activation time course (see text).
Figure 7
Figure 7. Amino acid sequences
Above, cartoon of the general primary structure of GABAA receptor subunits showing amino and carboxy termini, and four transmembrane spanning regions (shaded). The extracellular amino domain contains a cysteine loop (C-C). Lines indicate approximate location of amino acid sequences shown below. Region of protein involved in co-ordinating Zn2+ binding is putatively extracellular. Below, comparison of amino acid sequences of GABAA receptor subunits with homologous residues in the neighborhood of a ρ1 histidine (156) on extracellular amino terminus that is critical to Zn2+ inhibition of GABAC receptors (Wang et al. 1995). Amino acids are in three letter code and numbers refer to the codons of the predicted amino acid sequence of the full-length cDNA where the canonical methionine is codon 1. Arrow marks the location of the critical histidine (emboldened) of ρ1. Box encloses adjoining location on GABAA subunits that contains a histidine (emboldened) residue on the α1-, a neutral leucine on β2-, and a positively charged arginine on the γ2-subunit.

Similar articles

Cited by

References

    1. Akaike N, Yakushiji T, Tokutomi N, Carpenter DO. Mulitiple mechanisms of antagonism of γ-aminobutyric-acid (GABA) responses. Cellular and Molecular Neurobiology. 1987;7:97–103. - PMC - PubMed
    1. Aniksztejn L, Charlton G, Ben-Ari Y. Selective release of endogenous zinc from the hippocampal mossy fibers in situ. Brain Research. 1987;404:58–64. 10.1016/0006-8993(87)91355-2. - DOI - PubMed
    1. Assaf SY, Chung SH. Release of endogenous Zn2+ from brain tissue during activity. Nature. 1984;308:734–738. - PubMed
    1. Burkat PM, Roberts W, Gingrich KJ. Gamma subunit influences the mechanism of zinc inhibition in recombinant GABAA receptors. Journal of Neuroscience. 1995;21:A850.
    1. Calvo DJ, Vazquez AE, Miledi R. Cationic modulation of rho1 type gamma-aminobutyrate receptors expressed in Xenopus oocytes. Proceedings of the National Academy of Sciences of the USA. 1994;91:12725–12729. - PMC - PubMed

Publication types

LinkOut - more resources