. 1998 Feb 1;506 ( Pt 3)(Pt 3):665-78.
doi: 10.1111/j.1469-7793.1998.665bv.x.

Characterization of the hyperpolarization-activated chloride current in dissociated rat sympathetic neurons

Affiliations

Characterization of the hyperpolarization-activated chloride current in dissociated rat sympathetic neurons

S Clark et al. J Physiol. .

Abstract

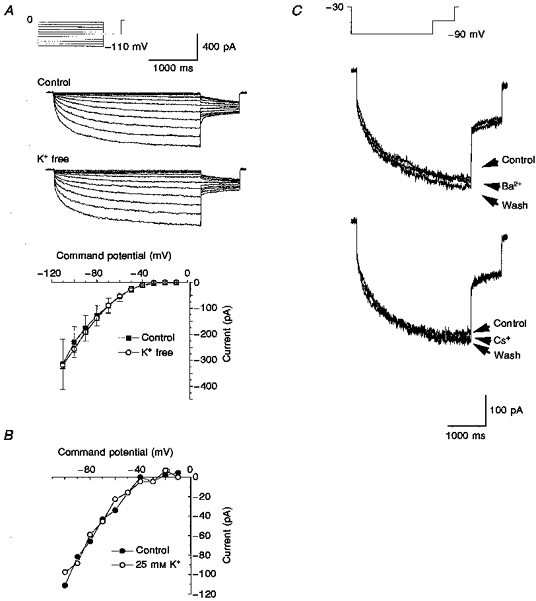
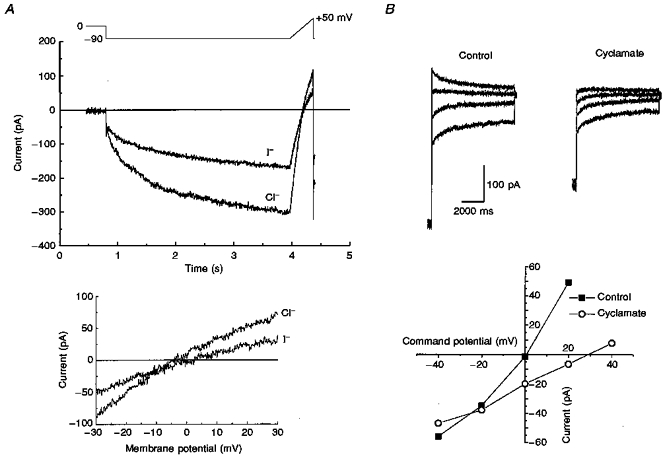
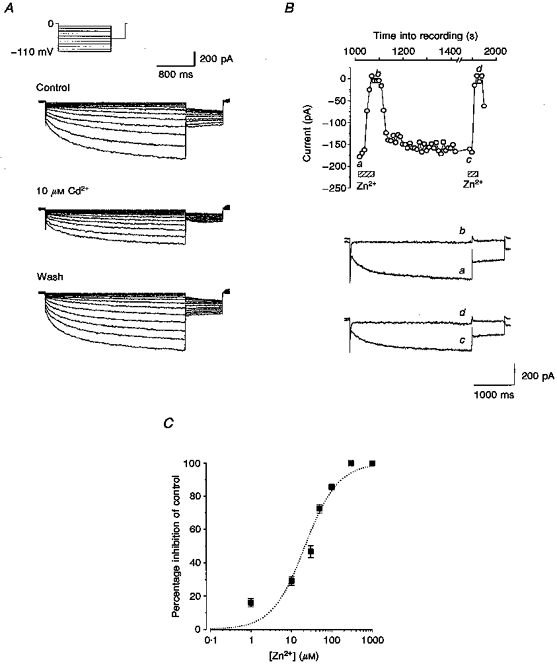
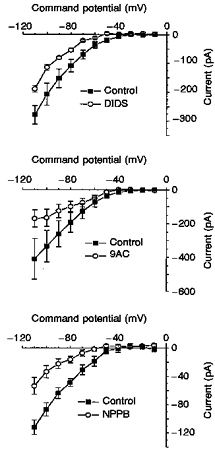
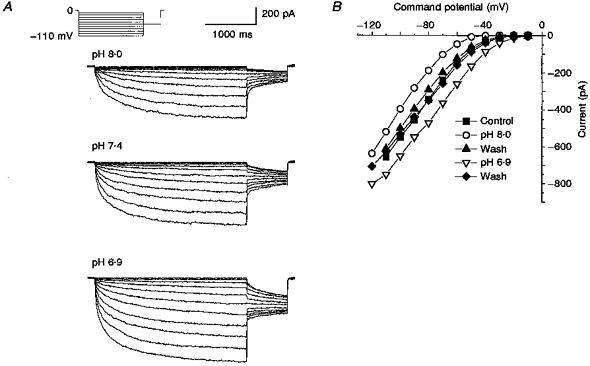
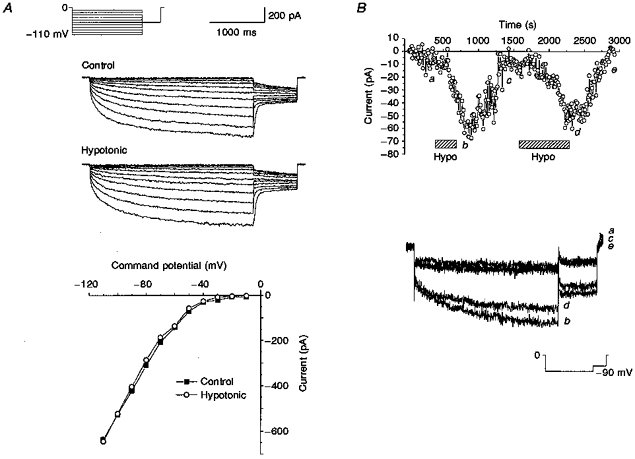
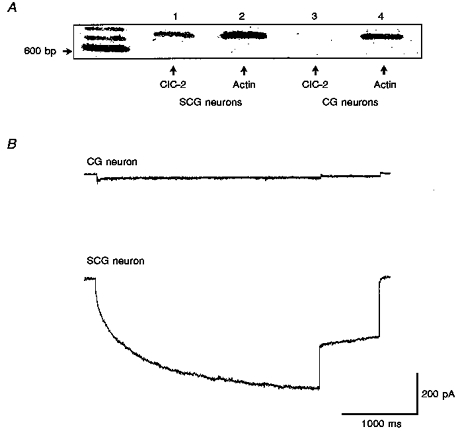
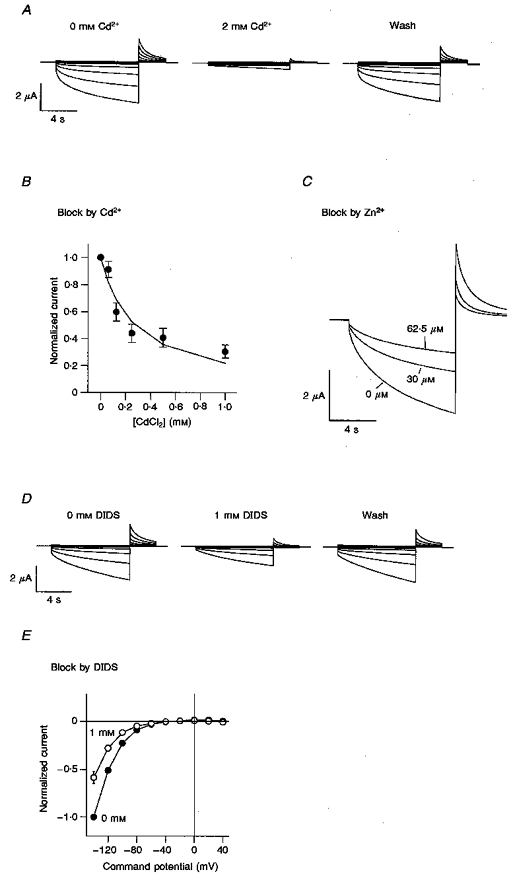
1. Dissociated rat superior cervical ganglion (SCG) neurons have been shown to possess a hyperpolarization-activated inwardly rectifying chloride current. The current was not altered by changes in external potassium concentration, replacing external cations with NMDG (N-methyl-D-glucamine) or by addition of 10 mM caesium or barium ions. 2. The reversal potential of the current was altered by changing external anions. The anion selectivity of the current was Cl- > Br- > I- > cyclamate. All substituted permeant anions also blocked the current. 3. The current was blocked by DIDS (4,4'-diisothiocyanatostilbene-2,2'-disulphonic acid), 9AC (anthracene-9-carboxylic acid) and NPPB (5-nitro-2-(3-phenylpropylamino)benzoic acid) but was unaffected by SITS (4-acetamido-4'-isothiocyanatostilbene- 2,2'-disulphonic acid) and niflumic acid. The effective blockers were voltage dependent; DIDS and NPPB were more effective at depolarized potentials while 9AC was more effective at hyperpolarized potentials. 4. The current was enhanced by extracellular acidification and reduced by extracellular alkalinization. Reducing external osmolarity was without effect in conventional whole-cell recording but enhanced current amplitude in those perforated-patch recordings where little current was evident in control external solution. 5. The current in SCG neurons was blocked by external cadmium and zinc. ClC-2 chloride currents expressed in Xenopus oocytes were also sensitive to block by these divalent ions and by DIDS but the sensitivity of ClC-2 to block by cadmium ions was lower than that of the current in SCG neurons. 6. Reverse transcriptase-polymerase chain reaction (RT-PCR) experiments showed the presence of mRNA for ClC-2 in SCG neurons but not in rat cerebellar granule cells which do not possess a hyperpolarization-activated Cl- current. 7. The data suggest that ClC-2 may be functionally expressed in rat SCG neurons. This current may play a role in regulating the internal chloride concentration in these neurons and hence their response to activation of GABAA receptors.


Figures

Figure 1
Figure 1. A non-cationic hyperpolarization-activated current in SCG neurons
A, current traces in control and K+-free solutions were generated by applying hyperpolarizing voltage steps from between -10 and -110 mV for 3 s from a holding potential of 0 mV followed by a 0.8 s step to -60 mV once every 10 s. The graph shows mean current-voltage relationships for time-dependent current in control (▪) and K+-free (○) solutions. Data are means ±s.e.m.; n= 7 for control, n= 24 for K+-free solution. B, current-voltage relationships in control (•) and 25 mM K+ (○) solutions in a single cell. C, currents obtained in the presence and absence of 10 mM Ba2+ or Cs+ ions were evoked by 3 s steps to -90 mV from a holding potential of -30 mV followed by a 0.8 s step to -60 mV once every 10 s.
Figure 2
Figure 2. Anion permeability of ICl,IR
A, ramp tail currents generated in control and NaI external solutions. Currents were evoked by a hyperpolarizing step to -90 mV for 3.15 s to activate ICl,IR then ramped from -90 to +50 mV at 0.35 mV ms−1 once every 12 s. The lower graph shows the current-voltage relationships close to their reversal potentials. B, examples of tail currents obtained in control solutions and cyclamate external solutions. Tail currents (4.75 s in duration) are shown at -40, -20, 0 and +20 mV following a hyperpolarizing step to -90 mV for 4.058 s once every 12 s to activate ICl,IR. The lower graph shows the time-dependent tail current amplitudes plotted against tail current potential in control and cyclamate solutions.
Figure 3
Figure 3. ICl,IR is blocked by Cd2+ and Zn2+
A, currents evoked by the same voltage protocol as Fig. 1A were obtained in control solution, in the presence of 10 μM Cd2+ and after wash. B, 300 μM Zn2+ completely and reversibly inhibits currents evoked by the same voltage protocol as Fig. 2B. Current traces a-d were recorded at the time points indicated. Internal solution contained 10 mM BAPTA and cell dialysis of 15 min had occurred before the data were recorded. C, concentration-response curve for inhibition by Zn2+ at -90 mV. Data for concentrations between 1 and 1000 μM (means ±s.e.m.; n=3 or 4 for each point) are fitted by the Hill equation with slope constrained to 1, giving an IC50 of 23 μM.
Figure 4
Figure 4. Effects of DIDS, 9AC and NPPB on ICl,IR
A, current-voltage relationships recorded in control and 1 mM DIDS using the protocol described in Fig. 1A. B, effect of 1 mM 9AC on the control current-voltage relationship. C, current-voltage relationships generated in control and then in the presence of 200 μM NPPB. All data are the means ±s.e.m. (n=3, 3 and 4 for DIDS, 9AC and NPPB, respectively).
Figure 5
Figure 5. Effect of changes in extracellular pH on ICl,IR
A, current traces generated using the protocol described for Fig. 1A in pH 8.0, 7.4 and 6.9 external solutions. B, plot of current-voltage relationships in control (pH 7.4), pH 6.9 and pH 8.0 external solutions together with two washes in control external solution.
Figure 6
Figure 6. Effect of a hypotonic external solution on ICl,IR recorded using conventional whole-cell and amphotericin B perforated patches
A, ICl,IR current-voltage relationships in conventional whole-cell recording in control and hypotonic external solution. Voltage protocol as described for Fig. 1A.B, amplitude of ICl,IR at -90 mV plotted against recording time in a perforated-patch recording. Hypotonic external solution was applied at the points indicated by the hatched bars. Current traces recorded as follows: a, in control; b, during the first application of hypotonic solution; c, after washout of the effects of hypotonic external solution; d, during the second application of hypotonic solution; e, after washout of the effects of the second application of hypotonic external solution. Protocol as described for Fig. 1C except that the holding potential was 0 mV.
Figure 7
Figure 7. ClC-2 mRNA is present in SCG neurons
A, image of a gel showing DNA bands obtained from SCG (lanes 1 and 2) and cerebellar granule (CG) neurons (lanes 3 and 4) by RT-PCR using primers for ClC-2 and actin. Size markers on the left are 600, 700 and 800 bp. Actin mRNA is present in both neurons (lanes 2 and 4) but ClC-2 mRNA is only present in SCGs (compare lanes 1 and 3). B, typical current traces recorded in a CG neuron (top) and SCG neuron (bottom) in response to the same voltage protocol as Fig. 1C except that the holding potential was 0 mV.
Figure 8
Figure 8. ClC-2 is blocked by Cd2+, Zn2+and DIDS
A, voltage clamp traces from an oocyte expressing rClC-2 before (left) and after a 1 min perfusion with 2 mM Cd2+ (middle) and after 3 min wash (right). Voltage was clamped for 9 s at values between +40 and -140 mV in steps of 20 mV from a holding voltage of -30 mV, followed by a 3 s step to +40 mV. B, block of ClC-2 by increasing concentrations of Cd2+ using the same voltage protocol as Fig. 8A except with a constant test step to -120 mV. Normalized data from 5 oocytes are shown. The IC50 is 280 μM when fitted with a Hill equation with slope constrained to 1. C, block of ClC-2 by Zn2+ using the same voltage protocol as Fig. 8B. Traces are shown in control and in the presence of 30 and 62.5 μM Zn2+. D, voltage clamp traces from an oocyte expressing rClC-2 before (left) and after a 1 min perfusion with 1 mM DIDS (middle) and after 3 min wash (right) using the same voltage protocol as Fig. 8A. E, current-voltage relationships obtained from 4 cells in the absence or presence of 1 mM DIDS. Currents have been normalized to the currents at -140 mV in the absence of DIDS.

Similar articles

Cited by

References

    1. Ackerman MJ, Wickman KD, Clapham DE. Hypotonicity activates a native chloride current in Xenopus oocytes. Journal of General Physiology. 1994;103:153–179. 10.1085/jgp.103.2.153. - DOI - PMC - PubMed
    1. Adams PR, Brown DA. Actions of gamma-aminobutyric acid on sympathetic ganglion cells. The Journal of Physiology. 1975;250:85–120. - PMC - PubMed
    1. Anderson MP, Sheppard DN, Berger HA, Welsh MJ. Chloride channels in the apical membrane of normal and cystic fibrosis airway and intestinal epithelia. American Journal of Physiology. 1992;263:L1–14. - PubMed
    1. Arreola J, Melvin JE, Begenisich T. Volume-activated chloride channels in rat parotid acinar cells. The Journal of Physiology. 1995;484:677–687. - PMC - PubMed
    1. Arreola J, Park K, Melvin JE, Begenisich T. Three distinct chloride channels control anion movements in rat parotid acinar cells. The Journal of Physiology. 1996;490:351–362. - PMC - PubMed

Publication types

MeSH terms

LinkOut - more resources