. 1998 Feb 1;506 ( Pt 3)(Pt 3):775-93.
doi: 10.1111/j.1469-7793.1998.775bv.x.

Electrophysiological and morphological heterogeneity of neurons in slices of rat suprachiasmatic nucleus

Affiliations

Electrophysiological and morphological heterogeneity of neurons in slices of rat suprachiasmatic nucleus

C M Pennartz et al. J Physiol. .

Abstract

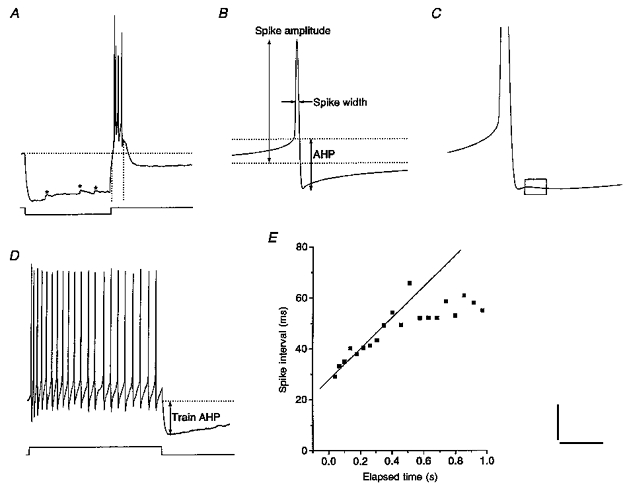
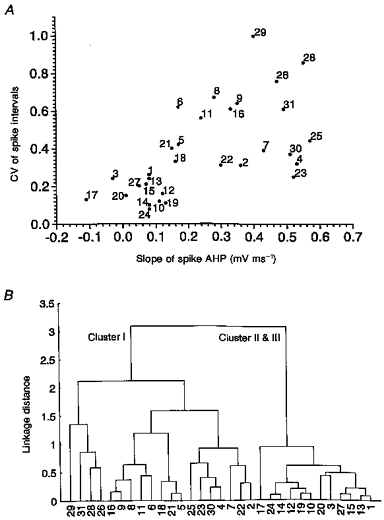
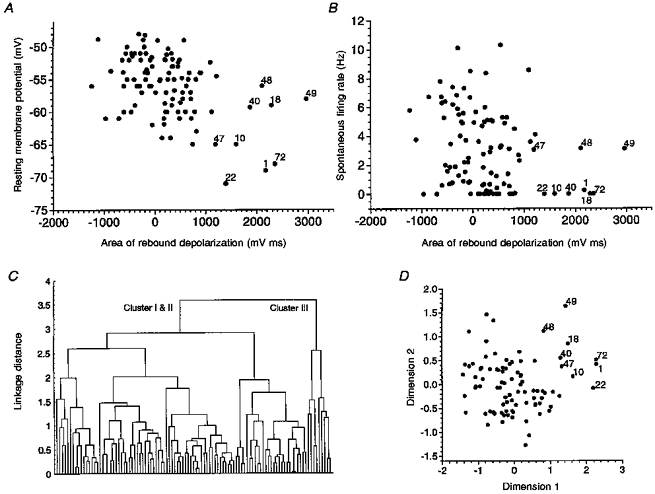
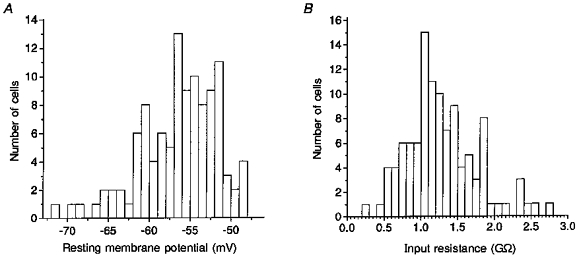
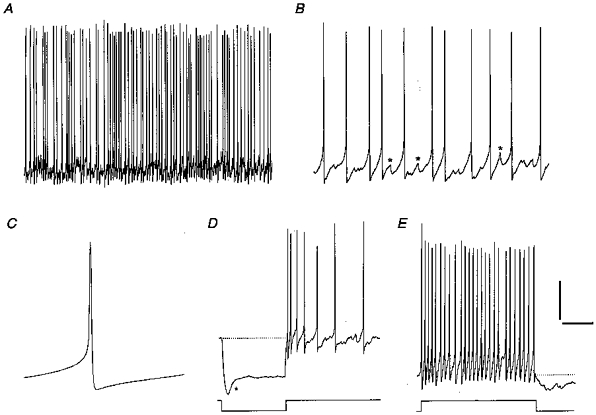
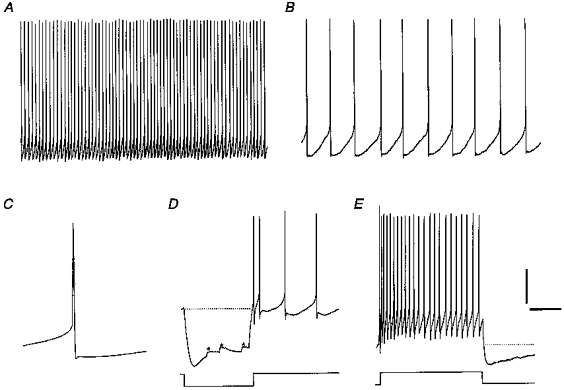
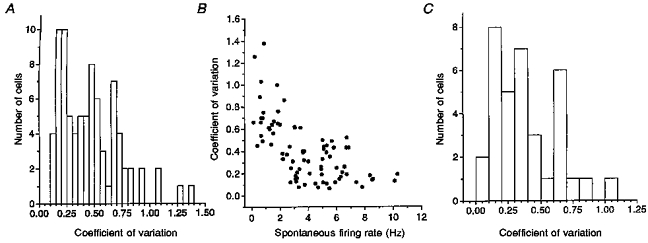
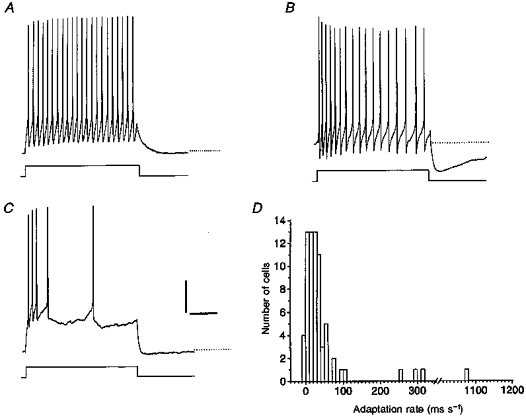
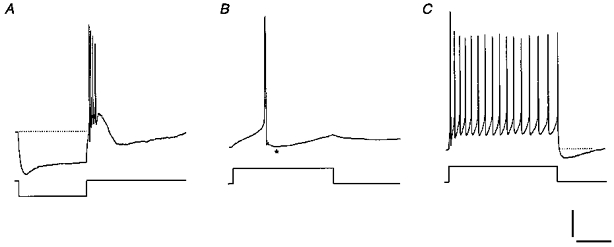
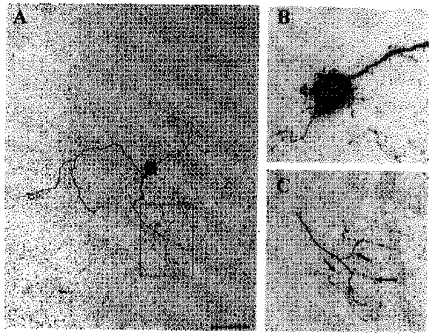
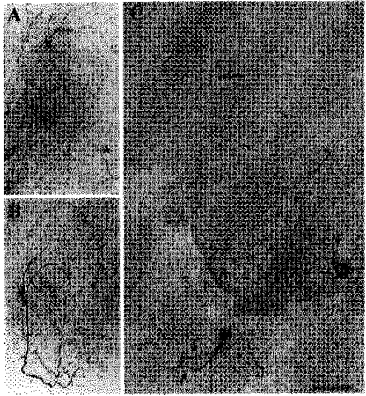
1. Whole cell patch clamp recordings of neurons in slices of the suprachiasmatic nucleus (SCN) were made in order to assess their electrophysiological and morphological heterogeneity. This assessment was accomplished by (i) quantification of intrinsic membrane properties recorded in current clamp mode, (ii) studying frequency distributions of these properties, (iii) grouping of cells based on visual inspection of data records, and (iv) use of cluster analysis methods. 2. Marked heterogeneity was found in the resting membrane potential, input resistance, time constant, rate of frequency adaptation, size of rebound depolarization (low-threshold Ca2+ potential) and regularity of firing. The frequency distribution of these membrane properties deviated significantly from a normal distribution. Other parameters, including spike amplitude and width, amplitude and rising slope of the spike after-hyperpolarization (AHP) and amplitude of the spike train AHP, showed considerable variability as well but generally obeyed a normal distribution. 3. Visual inspection of the data led to partitioning of cells into three clusters, viz. cluster I characterized by monophasic spike AHPs and irregular firing in the frequency range from 1.5 to 5.0 Hz; cluster II with biphasic spike AHPs and regular firing in the same range; and cluster III with large rebound depolarizations and biphasic spike AHPs. In a post hoc analysis, these clusters also appeared to differ in other membrane properties. This grouping was confirmed by hierarchical tree clustering and multidimensional scaling. 4. The light microscopic properties of recorded neurons were studied by biocytin labelling. Neurons had monopolar, bipolar or multipolar branching patterns and were often varicose. Axons sometimes originated from distal dendritic segments and usually branched into multiple collaterals. Many cells with extra-SCN projections also possessed intranuclear axon collaterals. We found no morphological differences between clusters except that cluster III neurons possessed more axon collaterals than cluster I or II cells. 5. These results suggest that SCN neurons are heterogeneous in some basic as well as active membrane properties and can be partitioned into at least three clusters. Cluster I and II cells fire spontaneously in a regular and irregular mode, respectively, and sustain prolonged spike trains. In contrast, cluster III cells have low firing rates but may adopt a burst-like firing mode when receiving appropriate input. While all clusters transmit output to target cells within and outside SCN, cluster III cells in particular are suggested to affect excitability of large numbers of SCN neurons by their extensive local network of axon collaterals.


Figures

Figure 1
Figure 1. Quantification of membrane properties recorded in current clamp mode
A, a current pulse of -40 pA revealed moderate time-dependent inward rectification. Upon release of negative current, the cell generated a large rebound depolarization carrying 4 spikes. This event was followed by a prolonged after-hyperpolarization. Asterisks mark spontaneous synaptic inputs. Horizontal dotted line indicates baseline and vertical dotted lines mark the 150 ms across which the area of the rebound depolarization was determined. B, the spike amplitude was measured with respect to baseline (lower dotted line). Upper dotted line indicates spike threshold level. The spike AHP was quantified as the difference between spike threshold and most negative voltage reached during the AHP. C, enlargement of spike and AHP in a different cell; rectangular box indicates the region across which the slope of the spike AHP was measured. Note the biphasic waveform of the AHP. D, a current pulse (+40 pA) evoked a spike train in another cell exhibiting moderate frequency adaptation. Spike train AHP was quantified by subtracting baseline level (dotted line) from the most negative voltage during the AHP. E, plot of spike interval versus time elapsed since onset of spike train. The regression line fitted to the initial part of the curve served as a measure for frequency adaptation. Records A-E are from different cells except D and E. Scale bars: A, 25 mV, 500 ms; B, 20 mV, 20 ms; C, 9 mV, 10 ms; D, 20 mV, 330 ms.
Figure 9
Figure 9. Cluster analysis based on CV and slope of the spike AHP
A, plot of CV of spike intervals versus the slope of the spike AHP for cells having spontaneous firing rates between 1.5 and 5.0 Hz. Except for an overall positive correlation, two clusters can be discerned having low CV and slope values, and high CV and slope values, respectively. B, dendrogram obtained by hierarchical tree clustering using the CV and slope of the spike AHP as variables. The numbers plotted along the abscissa label the same cells as indicated in A. The main right-hand branching (cells 1 to 17) corresponds to the group with low CV and slope values shown in A; this group mainly comprises cluster II and a few cluster III cells.
Figure 10
Figure 10. Cluster analysis based on the area of rebound depolarization, resting membrane potential and spontaneous firing rate
A, plot of resting membrane potential versus area of rebound depolarization. The points labelled by numerals correspond to cells belonging to cluster III according to visual data inspection. B, plot of spontaneous firing rate versus area of rebound depolarization. C, dendrogram obtained by hierarchical tree clustering using the area of rebound depolarization, resting membrane potential and spontaneous firing rate as variables. The main binary branching at linkage distance 3.6 segregates cluster I and II (left-hand branch) from cluster III (right-hand branch). Despite the large scattering of visually identified cluster III cells in A and B, all of these cells were placed in the right-hand cluster. D, multidimensional scaling solution for the distance matrix based on the same 3 variables. Cluster III neurons were grouped into the upper right corner of the scatter plot. Only a few members belonging to cluster I or II approached cluster III.
Figure 2
Figure 2. Frequency histograms of resting membrane potential (A) and input resistance (B)
A small portion of the cells exhibited abnormally negative Vrest values (A). In B, a few cells with exceptionally high input resistance stood out in the distribution.
Figure 3
Figure 3. Firing properties of an irregularly discharging cell (cluster I)
A and B, irregular firing displayed on two different time scales. Spontaneous events, including depolarizing ramps without spikes (asterisks), were interspersed between spikes. The SFR and CV of this cell were 4.9 Hz and 0.44, respectively. C, spike average from the same cell illustrating a monophasic AHP waveform. D, upon injection of hyperpolarizing current (-30 pA), the cell showed pronounced inward rectification (asterisk) but no rebound depolarization. Spontaneous synaptic input was sparse or absent in this neuron. E, spike train evoked by +30 pA showed little frequency adaptation and a ragged spike train AHP. Scale bars: A, 20 mV, 2.0 s; B, 20 mV, 250 ms; C, 20 mV, 30 ms; D, 30 mV, 500 ms; E, 20 mV, 250 ms.
Figure 4
Figure 4. Firing properties of a regularly discharging cell (cluster II)
A and B, regular firing displayed on the same time scales as in Fig. 3A and B. The SFR and CV were 4.7 Hz and 0.08, respectively. C, spike average of the same cell illustrating a biphasic AHP waveform. Note the clear distinction between the fast, spike-repolarizing component and the slow component. D, upon injection of hyperpolarizing current (-30 pA), the cell showed inward rectification and some spontaneous synaptic input (asterisks) but no rebound depolarization. E, spike train evoked by +30 pA showed clear frequency adaptation and a pronounced spike train AHP. Scale bars: A, 20 mV, 2.0 s; B, 20 mV, 250 ms; C, 20 mV, 40 ms; D, 30 mV, 500 ms; E, 20 mV, 300 ms.
Figure 5
Figure 5. Frequency distribution of the coefficient of variation for spike intervals and its relationship to the spontaneous firing rate
A, frequency distribution for all spontaneously firing neurons. Note the distinct peak around CV = 0.20 and at least two smaller peaks at higher CVs. B, with increasing spontaneous firing rate, there was an overall tendency for the CV to decline. Note, however, the large variability in CV for firing rates between about 1.5 and 5 Hz. C, frequency distribution for neurons firing at rates between 1.5 and 5.0 Hz. Peaks were found around CVs of 0.15, 0.35 and 0.65.
Figure 6
Figure 6. Heterogeneity in frequency adaptation and spike train after-hyperpolarization in SCN cells
A, a current pulse of +40 pA evoked a spike train showing no frequency adaptation. Note the absence of a spike train AHP. Dotted line is a baseline extension. B, clear frequency adaptation was present upon injection of +40 pA in another cell. Note that a pronounced AHP followed this spike train. C, cell generating a spike train with very rapidly widening spike intervals during injection of +40 pA current. This train was not accompanied by a pronounced AHP. D, frequency distribution of the rate of frequency adaptation. Only cells without substantial spike inactivation during the train were taken into account. A few outliers with large amounts of adaptation were identified. Scale bars: 20 mV and 250 ms (A-C).
Figure 7
Figure 7. Heterogeneity in the magnitude of rebound depolarizations
A, a current pulse of -21 pA evoked a hyperpolarization followed by a large rebound depolarization. Note the single rebound spike and the occurrence of wavelets (asterisk) after the spike. B, another cell generated a modest rebound depolarization following a current pulse (-21 pA) carrying one spike in addition to its normal spontaneous firing pattern. Note the biphasic spike AHP and time-dependent rectification. C, frequency distribution of the area of the rebound depolarization (see Fig. 1A). Note the small subgroup of cells having abnormally large rebound depolarizations.
Figure 8
Figure 8. Example of a cluster III neuron
A, current pulse of -30 pA evoked a large rebound depolarization with 4 spikes and a subsequent AHP. B, in the same cell, a spike elicited by a current pulse of +25 pA was followed by a biphasic AHP (asterisk). C, spike train clearly displaying frequency adaptation was evoked by a current pulse of +40 pA. Scale bars: 20 mV for (A-C); A, 500 ms; B, 50 ms; and C, 320 ms.
Figure 12
Figure 12. Morphology of cluster I neuron with somatic spines and axon collaterals originating from distal dendritic segments
This dendritic configuration is referred to as ‘dendroaxon’. The cell was reconstructed as in Fig. 11. A, overview of the neuron with soma, dendrites and axon collaterals. B, partial reconstruction of the soma and proximal dendrites showing numerous spines or prolonged appendages on both soma and dendrites. C, enlargement of the box shown in A, revealing axon collaterals (marked by arrows) originating from a distal dendrite. Note the fine calibre of the axons. Scale bar: A, 40 μm; B, 14 μm; C, 20 μm.
Figure 11
Figure 11. Light microscopic morphology of recorded neurons as revealed by biocytin labelling and three-dimensional reconstruction by a confocal laser scanning microscope
A, cluster I neuron having an axon projecting to the area of the paraventricular nucleus of the hypothalamus (marked by arrow) and a few local axon collaterals in the SCN (marked by asterisks). B, cluster III neuron with a characteristic large axon collateral network within the SCN. The collaterals carried large numbers of varicosities and coursed through the ventral SCN. No projection axon was identified in this cell. C, cluster II neuron having an axon projecting to a site dorsal to the SCN (thin arrow). This cell presents a clear example of varicose dendrites (thick, short arrows) and also possesses a small number of axon collaterals (marked by asterisks). Scale bar: A, 130 μm; B, 65 μm; C, 75 μm.

References

    1. Akasu T, Shoji S, Hasuo H. Inward rectifier and low-threshold calcium currents contribute to the spontaneous firing mechanism in neurons of the rat suprachiasmatic nucleus. Pflügers Archiv. 1993;425:109–116. - PubMed
    1. Blanton MG, Lo Turco JJ, Kriegstein AR. Whole cell recording from neurons in slices of reptilian and mammalian cerebral cortex. Journal of Neuroscience Methods. 1989;30:203–210. - PubMed
    1. Bouskila Y, Dudek FE. Neuronal synchronization without calcium-dependent synaptic transmission in the hypothalamus. Proceedings of the National Academy of Sciences of the USA. 1993;90:3207–3210. - PMC - PubMed
    1. Bouskila Y, Dudek FE. A rapidly activating type of outward rectifier K+ current and A-current in rat suprachiasmatic nucleus neurones. The Journal of Physiology. 1995;488:339–350. - PMC - PubMed
    1. Buijs RM, Wortel J, Hou Y-X. Colocalization of gamma-aminobutyric acid with vasopressin, vasoactive intestinal peptide, and somatostatin in the rat suprachiasmatic nucleus. Journal of Comparative Neurology. 1995;358:343–352. - PubMed

Publication types

LinkOut - more resources