. 1998 Apr 15;508 ( Pt 2)(Pt 2):575-85.
doi: 10.1111/j.1469-7793.1998.575bq.x.

Focally recorded single sympathetic postganglionic neuronal activity supplying rat lateral tail vein

Affiliations

Focally recorded single sympathetic postganglionic neuronal activity supplying rat lateral tail vein

C D Johnson et al. J Physiol. .

Abstract

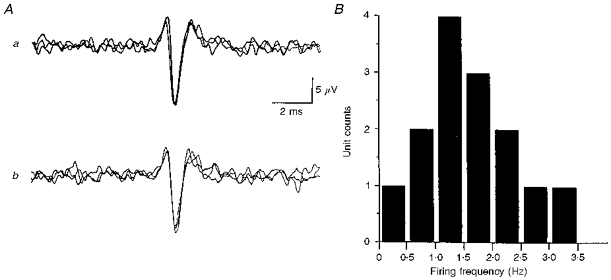
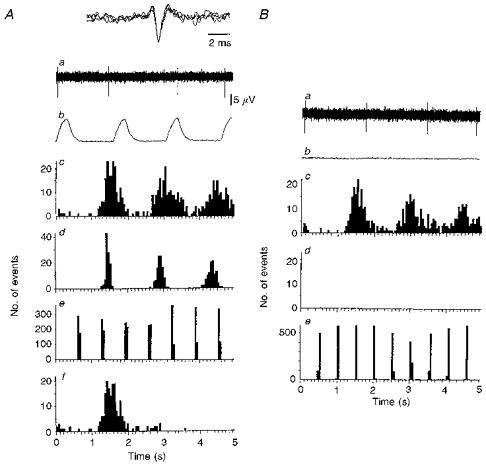
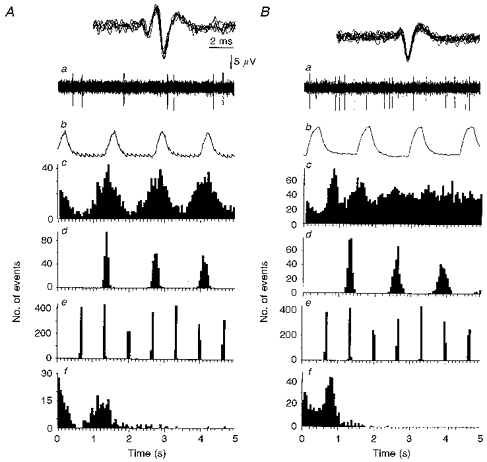
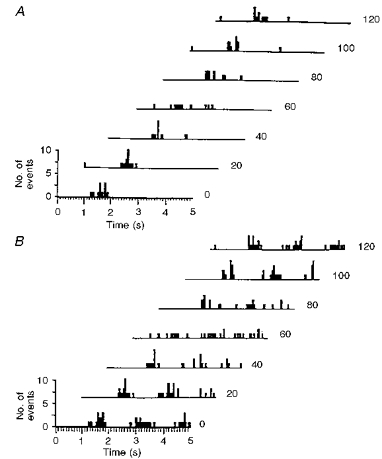
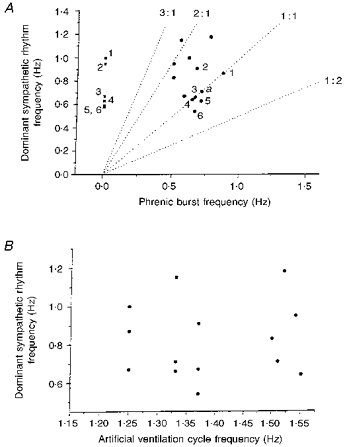
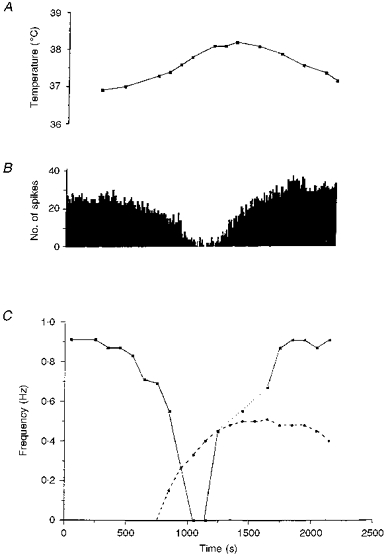
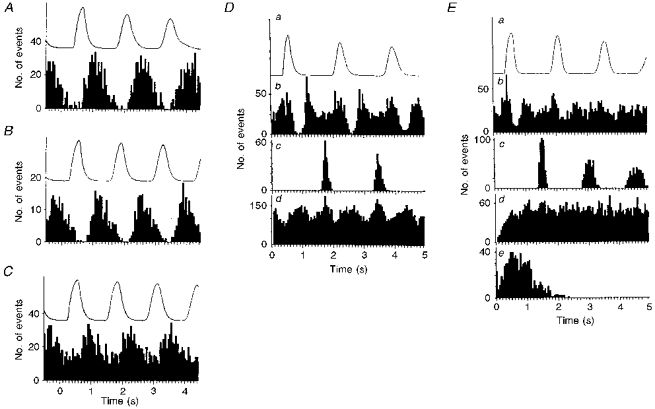
1. In anaesthetized rats, using a focal recording technique, activity was recorded from single sympathetic postganglionic neurones innervating the lateral tail veins. On-going activity was examined in order to determine whether it had similar or different characteristics to those recorded from the caudal ventral artery in a previous study. 2. Animals were artificially ventilated, vagotomized, paralysed and given a pneumothorax. 3. The discharges of fourteen out of seventeen sympathetic postganglionic neurones were rhythmic. Such units had a mean firing frequency of 1.62 +/- 0. 70 Hz. The mean frequency of the dominant sympathetic rhythm under control conditions was 0.82 +/- 0.05 Hz. 4. The frequency of the dominant sympathetic rhythm was different from that of the phrenic rhythm in nine out of fourteen cases. 5. The mean frequency of the dominant sympathetic rhythm was: (i) not influenced significantly by hypocapnic apnoea, (ii) decreased by hyperthermia, which increased the frequency of the phrenic rhythm, (iii) in all cases different from that of the artificial ventilation cycle. 6. The above characteristics are similar to those recorded from the sympathetic supply to the caudal ventral artery of the same vascular bed under comparable conditions.


Figures

Figure 1
Figure 1. Unit identification and mean firing frequency
A, single unit identification: similar shape and amplitude of on-going and evoked action potentials. a, activity evoked in response to trans-tail stimulation (3 trials; sweep delay, 185 ms; distance between stimulus site and recording location, 80 mm). Such stimulation activates sympathetic postganglionic neurones innervating the lateral vein. Consequently, evoked responses have a constant latency. b, 3 superimposed on-going action potentials of the discriminated unit shown in a (TTL pulses generated from action potential used to trigger computer). B, histogram showing the distribution of mean firing frequencies of 14 rhythmically discharging sympathetic postganglionic neurones supplying the lateral vein.
Figure 2
Figure 2. Type A firing pattern where the modal frequency of the sympathetic rhythm is close to that of the phrenic rhythm
A and B are discharges from the same unit (no. 5 in Fig. 5A). A, normocapnia. B, hypocapnic apnoea. a, neurogram of unit activity where the dominant sympathetic rhythm presented as single action potentials. Inset in Aa, all action potentials in neurogram superimposed to demonstrate similar shape and amplitude characteristic of single units. b, rectified and smoothed phrenic activity over the same period as that shown in a. Note phrenic silence in Ab. c, autocorrelogram of unit activity shown in a (triggers over 300 s: A, 193; B, 183). d, autocorrelogram of phrenic bursts over same period as c (A, 200 triggers; B, 0 triggers - phrenic silence). e, autocorrelogram of lung inflation over same period as in c (derived from tracheal pressure: A, 464 triggers; B, 592 triggers). Af, ISIH of unit activity over same period as in c - type A firing profile. Comparing Ac with Ad, it can be seen that the activity of the sympathetic unit has a periodicity close to that of the phrenic bursts (nearly 1 : 1 relationship). As different peripheral delays cause phase shifts, allowing for about a 350 ms greater peripheral delay in the sympathetic outflow than the phrenic, sympathetic discharges fall mainly in early expiration (compare Aa and Ab). Note that comparing Ac with Ad does not provide any information regarding phase relationship as they are autocorrelograms.
Figure 3
Figure 3. Type B and C firing patterns
A, type B firing pattern where the modal frequency of the dominant sympathetic rhythm is the same as that of the phrenic rhythm. B, type C firing pattern where the modal frequency of the dominant sympathetic rhythm is different from that of the phrenic rhythm. a, neurogram of sympathetic unit activity showing discharges occurring in doublets (A), or characteristic bursts on ‘tonic’ (B). Inset, all action potentials in neurogram superimposed to demonstrate similar shape and amplitude characteristic of single units. b, rectified and smoothed phrenic activity over the same period as that shown in a. c, autocorrelogram of unit activity shown in a (A, 332 triggers over 300 s; B, 657 triggers over 300 s). d, autocorrelogram of phrenic bursts over the same period as in c (A, 220 triggers; B, 233 triggers). e, autocorrelogram of lung inflation over the same period as in c (derived from tracheal pressure: A, 452 triggers; B, 454 triggers). f, ISIH of unit activity over the same period as in c showing a typical type B profile (A, see text), or type C firing profile (B). In Ba, the rhythmical discharge of the sympathetic unit is not apparent from the neurogram. However, comparing the autocorrelograms in Bc and d, the ratio of the frequency of the dominant sympathetic rhythm to that of the phrenic is close to 3:2.
Figure 4
Figure 4. Stability of pattern and rhythmicity
A, pattern. Waterfall ISIHs produced from 7 consecutive 20 s data sets showing a transient change in interspike interval distribution (3rd and 4th histograms from top). B, rhythmicity. Waterfall autocorrelograms (from same data set used in A) show that the rhythmic nature of the unit's discharge is disrupted concurrently with the change in interspike interval distribution (3rd and 4th histogram from top). Thus, pattern and rhythmicity over longer data sets are the ‘preferred’ pattern or rhythmicity of the unit.
Figure 5
Figure 5. Scatter diagrams relating the frequency of the dominant sympathetic rhythm to the respiratory frequencies
A, scatter diagram relating the frequency of the dominant sympathetic rhythm and that of the phrenic rhythm in 14 cases during normocapnia and normothermia, and 6 cases in hypocapnic apnoea (nos 1-6 indicate points taken from the same unit in both hypocapnia and normocapnia). ▪, during hypocapnic apnoea. •, during normocapnia (a denotes 2 cases superimposed). Dotted lines represent frequencies at which sympathetic and phrenic rhythms have a 3:1, 2:1, 1:1 and 1:2 relationship. Note that integer and non-integer ratios occur. B, scatter diagram relating the frequency of the dominant sympathetic rhythm to that of the artificial ventilation cycle during normocapnia and normothermia (n = 14). It can be seen that the artificial ventilation was never related 1:1 to the dominant sympathetic rhythm. Therefore the sympathetic bursts were not a direct result of the stimulation of afferents during the lung inflation cycle.
Figure 6
Figure 6. Unit firing frequency, the dominant sympathetic rhythm and phrenic rhythm during whole-body warming to hyperthermia and return to normothermia
A, oesophageal temperature. B, histogram showing the firing frequency of the sympathetic unit (10 s bins). C, frequency of the dominant sympathetic rhythm (▪) and frequency of the phrenic rhythm (•). As temperature increased, the frequency of the phrenic rhythm increased. Meanwhile, the frequency of the dominant sympathetic rhythm decreased. During recovery, the sympathetic rhythm was lost transiently (dotted line). Note that the phrenic burst frequency remains elevated whilst that of the sympathetic rhythm returns to control.
Figure 7
Figure 7. Phrenic-triggered crosscorrelograms of unit activity
A, B and C, phrenic-triggered crosscorrelograms of unit activities shown in Figs 3A, 2A and 3B, respectively. In A and B, the frequencies of the dominant sympathetic rhythm and phrenic discharges were similar and identical, respectively (A, 200 triggers; B, 220 triggers; see Figs 2 and 3A). Note that in both cases peak activities occur during expiration with little if any activity during inspiration (phase relationships have been adjusted to take into account different conduction times in the two pathways). In C (233 triggers), although there was a close to 3:2 relationship between the dominant sympathetic rhythm and the phrenic frequency, peak activity also occurs during expiration but with substantial activity occurring during inspiration. This is probably because at this ratio two sympathetic bursts occur during expiration for each that occurs during inspiration. D and E (from different units) have the same format except that E contains an ISIH. In both D and E, all data shown are taken from the same 300 s data set. In D the frequency of the dominant sympathetic rhythm equals twice that of the phrenic rhythm, and in E there is no dominant sympathetic rhythm. For D and E: a, rectified and smoothed phrenic activity averaged over the period; b, phrenic-triggered crosscorrelogram of sympathetic activity over same period as in a (D, 181 triggers; E, 198 triggers); c, phrenic-triggered autocorrelogram (over the same period and same number of triggers as above); d, autocorrelograms of sympathetic unit activity (D, 884 triggers, E, 786 triggers). Ee, ISIH of unit activity.

Similar articles

Cited by

References

    1. Andrews T J. PhD Thesis. University of London; 1993. The role of targets and growth factors in neuronal ageing.
    1. Aukland K, Wiig H. Haemodynamics and interstitial fluid pressure in the rat tail. American Journal of Physiology. 1984;247:H80–87. - PubMed
    1. Bevan J A, Bevan R D, Duckles S P. Adrenergic regulation of smooth muscle. In: Shepherd J T, Abboud F M, editors. Handbook of Physiology, section 2, The Cardiovascular System. III. Bethesda, MD, USA: American Physiological Society; 1986. pp. 515–566. part 1.
    1. Dehal N S, Kartseva A G, Weaver L C. Comparisons of locations and peptide content of postganglionic nerves innervating veins and arteries of the rat hindlimb. Journal of the Autonomic Nervous System. 1992;39:61–72. 10.1016/0165-1838(92)90251-B. - DOI - PubMed
    1. Donegan J F. The physiology of veins. Journal of Physiology. 1921;55:226–245. - PMC - PubMed

Publication types

LinkOut - more resources