Clinical Trial
. 1998 Apr 15;508 ( Pt 2)(Pt 2):625-33.
doi: 10.1111/j.1469-7793.1998.625bq.x.

Effects of voluntary contraction on descending volleys evoked by transcranial stimulation in conscious humans

Affiliations
Clinical Trial

Effects of voluntary contraction on descending volleys evoked by transcranial stimulation in conscious humans

V Di Lazzaro et al. J Physiol. .

Abstract

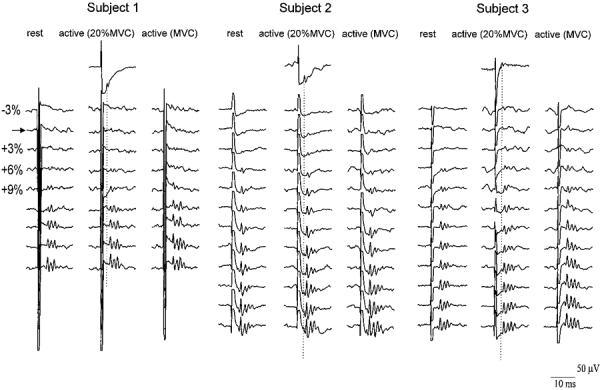
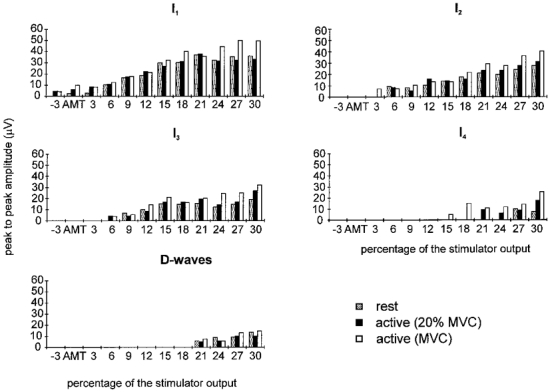
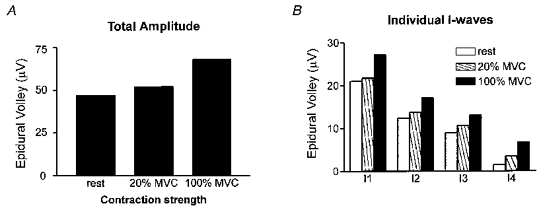
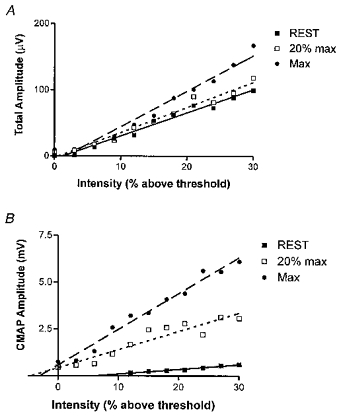
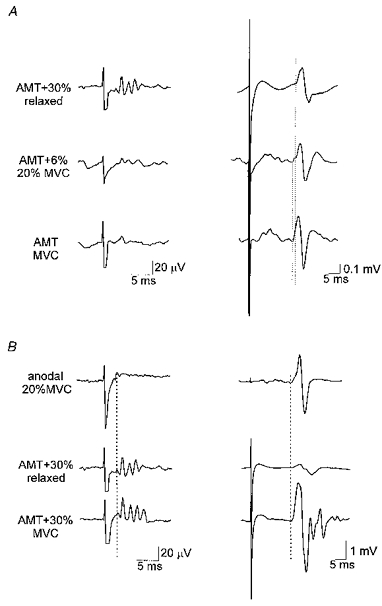
1. The spinal volleys evoked by single transcranial magnetic or electric stimulation over the cerebral motor cortex were recorded from a bipolar electrode inserted into the cervical epidural space of three conscious human subjects. These volleys were termed direct (D) and indirect (I) waves according to their latency. 2. We measured the size and number of volleys elicited by magnetic stimulation at various intensities with subjects at rest and during 20 or 100 % maximum contraction of the contralateral first dorsal interosseous muscle (FDI). Surface EMG activity was also recorded. 3. Electrical stimulation evoked a D-wave volley. Magnetic stimulation at intensities up to about 15 % of stimulator output above threshold evoked only I-waves. At higher intensities, a D-wave could be seen in two of the three subjects. 4. At all intensities tested, voluntary contraction increased the number and size of the I-waves, particularly during maximum contractions. However, there was only a small effect on the threshold for evoking descending activity. Voluntary contraction produced large changes in the size of EMG responses recorded from FDI. 5. Because the recorded epidural activity is destined for muscles other than the FDI, it is impossible to say to what extent increased activity contributes to voluntary facilitation of EMG responses. Indeed, our results suggest that the main factor responsible for enhancing EMG responses in the transition from rest to activity is likely to be increased excitability of spinal motoneurones, rather than increases in the corticospinal volley. The latter may be more important in producing EMG facilitation at different levels of voluntary contraction.


Figures

Figure 1
Figure 1. Descending volleys evoked by magnetic stimulation using increasingly strong stimulus intensities and with different degrees of voluntary contraction in three subjects
The traces show averaged (10 sweeps each) epidural recordings from the high cervical cord. The vertical columns of traces are arranged in order of increasing magnetic stimulus intensity, from 3% of stimulator output below the threshold for evoking EMG responses in active muscle (horizontal row marked by arrow) to 21% (subject 1) or 30% (subjects 2 and 3) above threshold in steps of 3%. Each subject contributes 3 columns of results, recorded at rest (left), 20% maximum contraction (middle) and 100% maximum contraction (right) of FDI muscle. The single trace for each subject in the top row shows the potentials recorded after transcranial electrical stimulation of the motor cortex. The stimulus intensity in this trace was 5% of stimulator output above the threshold for evoking EMG responses in active muscle, and the responses were recorded during a voluntary contraction of 20% maximum. The peak latency of the first volley evoked by electrical stimulation (D-wave) is indicated by the vertical dotted line. In all three subjects and in all recording conditions the size and number of waves increased as the stimulus intensity was increased. The waves recruited by low intensity magnetic stimulation are probably I-waves. At high intensities, a D-wave can be seen in subjects 2 and 3. Voluntary contraction, particularly at maximum strength, slightly reduces the threshold intensity at which magnetic stimulation evokes I-waves, and increases their amplitude and number at higher intensities.
Figure 2
Figure 2. Mean amplitude of the epidural volleys evoked by magnetic stimulation using increasingly strong stimulus intensities and with different degrees of voluntary contraction
Histograms showing the mean amplitude of the different epidural volleys recorded in the three patients during stimulation at different intensities and with different levels of background contraction. The amplitude of the volleys is larger during contraction, and the threshold for evoking the later I-waves and the D-wave is higher than that for the early waves. The average standard error limit on these bars was 11 μV.
Figure 3
Figure 3. Effect of contraction strength on the amplitude of epidural volleys
A shows how the grand mean amplitude of the epidural volleys varied with contraction strength. In B these data have been separated for each of the individual I-waves. The average standard error on these bars was 3.4 μV.
Figure 4
Figure 4. Relationships between amplitude of epidural volley peak-to-peak size of the evoked EMG response in FDI, and the intensity of magnetic stimulation
A, intensity of stimulation (x-axis) plotted against the total amplitude of the epidural volley (y-axis). The values at each intensity have been averaged across subjects and plotted as a single point at each contraction level. Linear regression lines are plotted and have the following slopes: rest = 3.45, r2 = 0.98; 20% max = 3.80, r2 = 0.97; 100% max = 5.36, r2 = 0.97. Only the slope at 100% maximum contraction is significantly different from that at rest (P < 0.05). B, intensity of stimulation (x-axis) plotted against the peak-to-peak size of the EMG response in FDI. The values at each intensity have been averaged across subjects and plotted as a single point. The regression slopes are: rest = 0.025, r2 = 0.97; 20% max = 0.097, r2 = 0.89; 100% max = 0.19, r2 = 0.98. There is a significant difference in slope between all three lines (P < 0.05).
Figure 5
Figure 5. Relationship of epidural volleys to surface EMG responses in FDI
Averaged recordings from the epidural electrode are shown on the left; EMG responses from the FDI are shown on a longer time scale on the right. A, similar sized EMG responses evoked at different contraction strengths. At rest, a magnetic stimulus 30% of stimulator output above threshold is needed, whereas at 20% maximum contraction the intensity can be reduced to 6% above threshold, whilst at maximum contraction, only a threshold stimulus is needed. Note the corresponding reduction in the size and number of epidural volleys, and the longer latency of the EMG response recorded at rest (vertical dotted line). B, comparison of responses to anodal and magnetic stimulation. Responses to anodal stimulation were recorded during a 20% maximum contraction (20% MVC), and show a D-wave in the epidural recording (vertical dotted line, left trace), with a biphasic EMG response. At rest, a large magnetic stimulus (second pair of traces from top) evokes a small D-wave and three I-waves, but the resulting EMG response is small. However, when the subject contracts maximally (MVC), a fourth I-wave becomes visible, and the EMG response is much bigger and more complex.

References

    1. Baker S N, Olivier E, Lemon R N. Task-related variation in corticospinal output evoked by transcranial magnetic stimulation in the macaque monkey. Journal of Physiology. 1995;488:795–801. - PMC - PubMed
    1. Burke D, Hicks R, Gandevia S C, Stephen J, Woodforth I, Crawford M. Direct comparison of corticospinal volleys in human subjects to transcranial magnetic and electrical stimulation. Journal of Physiology. 1993;470:383–393. - PMC - PubMed
    1. Burke D, Hicks R G, Stephen J P H. Corticospinal volleys evoked by anodal and cathodal stimulation of the human motor cortex. Journal of Physiology. 1990;425:283–299. - PMC - PubMed
    1. Day B L, Dressler D, Maertens De Noordhout A, Marsden C D, Nakashima K, Rothwell J C, Thompson P D. Electric magnetic stimulation of human motor cortex: surface EMG and single motor unit responses. Journal of Physiology. 1989;412:449–473. - PMC - PubMed
    1. Day B L, Rothwell J C, Thompson P D, Dick J P R, Kachi T, Cowan J M A, Marsden C D. Motor cortex stimulation in intact man. II. Multiple descending volleys. Brain. 1987;110:1191–1120. - PubMed

Publication types

LinkOut - more resources