

Interaction of H+ and Zn2+ on recombinant and native rat neuronal GABAA receptors
- PMID: 9508826
- PMCID: PMC2230811
- DOI: 10.1111/j.1469-7793.1998.639bs.x
Interaction of H+ and Zn2+ on recombinant and native rat neuronal GABAA receptors
Abstract
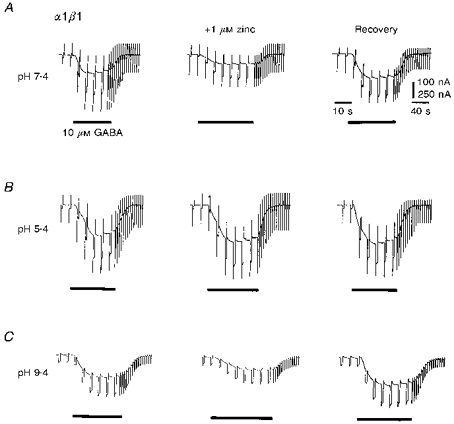
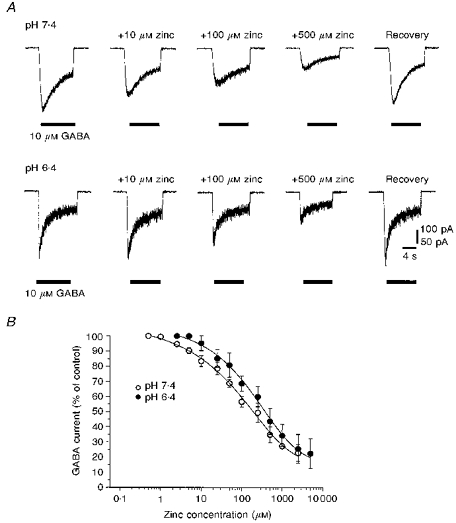
1. The interaction of Zn2+ and H+ ions with GABAA receptors was examined using Xenopus laevis oocytes expressing recombinant GABAA receptors composed of subunits selected from alpha1, beta1, gamma2S and delta types, and by using cultured rat cerebellar granule neurones. 2. The potency of Zn2+ as a non-competitive antagonist of GABA-activated responses on alpha1beta1 receptors was reduced by lowering the external pH from 7.4 to 5.4, increasing the Zn2+ IC50 value from 1.2 to 58.3 microM. Zinc-induced inhibition was largely unaffected by alkaline pH up to pH 9.4. 3. For alpha1beta1delta subunits, concentration-response curves for GABA were displaced laterally by Zn2+ in accordance with a novel mixed/competitive-type inhibition. The Zn2+ IC50 at pH 7.4 was 16.3 microM. Acidification of Ringer solution resulted in a reduced antagonism by Zn2+ (IC50, 49.0 microM) without affecting the type of inhibition. At pH 9.4, Zn2+ inhibition remained unaffected. 4. The addition of the gamma2S subunit to the alpha1beta1delta construct caused a marked reduction in the potency of Zn2+ (IC50, 615 microM), comparable to that observed with alpha1beta1gamma2S receptors (IC50 639 microM). GABA concentration-response curves were depressed in a mixed/non-competitive fashion. 5. In cultured cerebellar granule neurones, Zn2+ inhibited responses to GABA in a concentration-dependent manner. Lowering external pH from 7.4 to 6.4 increased the IC50 from 139 to 253 microM. 6. The type of inhibition exhibited by Zn2+ on cerebellar granule neurones, previously grown in high K+-containing culture media, was complex, with the GABA concentration-response curves shifting laterally with reduced slopes and similar maxima. The Zn2+-induced shift in the GABA EC50 values was reduced by lowering the external pH from 7.4 to 6.4. 7. The interaction of H+ and Zn2+ ions on GABAA receptors suggests that they share either a common regulatory pathway or coincident binding sites on the receptor protein. The apparent competitive mode of block induced by Zn2+ on alpha1beta1delta receptors is shared by GABAA receptors on cerebellar granule neurones, which are known to express delta-subunit-containing receptors. This novel mechanism is masked when a gamma2 subunit is incorporated into the receptor complex, revealing further diversity in the response of native GABAA receptors to endogenous cations.
Figures


Similar articles
-
Differential effects of zinc on native GABA(A) receptor function in rat hippocampus and cerebellum.Neurochem Int. 1999 May;34(5):399-405. doi: 10.1016/s0197-0186(99)00043-1. Neurochem Int. 1999. PMID: 10397368
-
Zn2+ inhibition of recombinant GABAA receptors: an allosteric, state-dependent mechanism determined by the gamma-subunit.J Physiol. 1998 Feb 1;506 ( Pt 3)(Pt 3):609-25. doi: 10.1111/j.1469-7793.1998.609bv.x. J Physiol. 1998. PMID: 9503325 Free PMC article.
-
Identification of a Zn2+ binding site on the murine GABAA receptor complex: dependence on the second transmembrane domain of beta subunits.J Physiol. 1997 Dec 15;505 ( Pt 3)(Pt 3):633-40. doi: 10.1111/j.1469-7793.1997.633ba.x. J Physiol. 1997. PMID: 9457641 Free PMC article.
-
Direct activation of GABAA receptors by loreclezole, an anticonvulsant drug with selectivity for the beta-subunit.Neuropharmacology. 1996;35(12):1753-60. doi: 10.1016/s0028-3908(96)00138-4. Neuropharmacology. 1996. PMID: 9076754
-
α6-Containing GABAA Receptors: Functional Roles and Therapeutic Potentials.Pharmacol Rev. 2022 Jan;74(1):238-270. doi: 10.1124/pharmrev.121.000293. Pharmacol Rev. 2022. PMID: 35017178 Review.
Cited by
-
Functional characterization of the 1,5-benzodiazepine clobazam and its major active metabolite N-desmethylclobazam at human GABA(A) receptors expressed in Xenopus laevis oocytes.PLoS One. 2015 Mar 23;10(3):e0120239. doi: 10.1371/journal.pone.0120239. eCollection 2015. PLoS One. 2015. PMID: 25798598 Free PMC article.
-
Two gamma2L subunit domains confer low Zn2+ sensitivity to ternary GABA(A) receptors.J Physiol. 2001 Apr 1;532(Pt 1):17-30. doi: 10.1111/j.1469-7793.2001.0017g.x. J Physiol. 2001. PMID: 11283222 Free PMC article.
-
Subunit-dependent modulation of neuronal nicotinic receptors by zinc.J Neurosci. 2001 Mar 15;21(6):1848-56. doi: 10.1523/JNEUROSCI.21-06-01848.2001. J Neurosci. 2001. PMID: 11245669 Free PMC article.
-
Modulation of GABA(A) receptors by hydrogen ions reveals synaptic GABA transient and a crucial role of the desensitization process.J Neurosci. 2003 Sep 3;23(22):7981-92. doi: 10.1523/JNEUROSCI.23-22-07981.2003. J Neurosci. 2003. PMID: 12954859 Free PMC article.
-
Unanticipated structural and functional properties of delta-subunit-containing GABAA receptors.J Biol Chem. 2009 Mar 20;284(12):7889-96. doi: 10.1074/jbc.M806484200. Epub 2009 Jan 13. J Biol Chem. 2009. PMID: 19141615 Free PMC article.
References
-
- Celentano JJ, Gyenes M, Gibbs TT, Farb DH. Negative modulation of the γ-aminobutyric acid responses by extracellular zinc. Molecular Pharmacology. 1991;40:766–773. - PubMed
-
- Chen JCT, Chesler M. Extracellular alkaline shifts in rat hippocampal slice are mediated by NMDA and non-NMDA receptors. Journal of Neurophysiology. 1992;68:342–344. - PubMed
-
- Chesler M. The regulation and modulation of pH in the nervous system. Progress in Neurobiology. 1990;34:401–427. - PubMed
-
- Chesler M, Kaila K. Modulation of pH by neuronal activity. Trends in Neurosciences. 1992;15:396–402. - PubMed
-
- Draguhn A, Verdoorn TA, Ewert M, Seeburg PH, Sakmann B. Functional and molecular distinction between recombinant rat GABAA receptor subtypes by Zn2+ Neuron. 1990;5:781–788. 10.1016/0896-6273(90)90337-F. - DOI - PubMed
Publication types
MeSH terms
Substances
LinkOut - more resources
Full Text Sources
Molecular Biology Databases