. 1998 Mar;180(6):1525-32.
doi: 10.1128/JB.180.6.1525-1532.1998.

Activation of Escherichia coli rRNA transcription by FIS during a growth cycle

Affiliations

Activation of Escherichia coli rRNA transcription by FIS during a growth cycle

J A Appleman et al. J Bacteriol. 1998 Mar.

Abstract

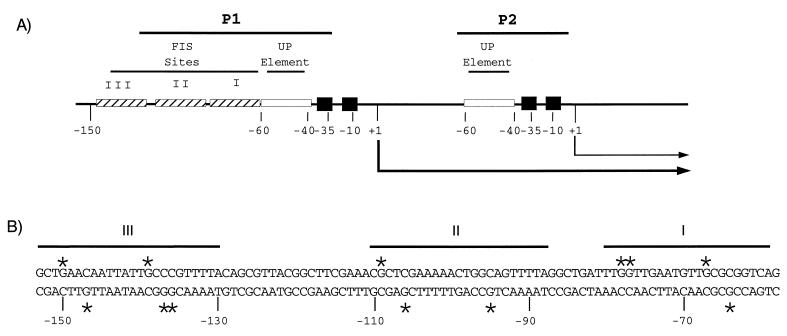
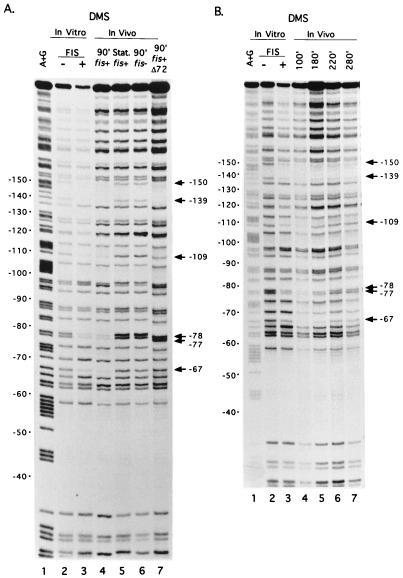
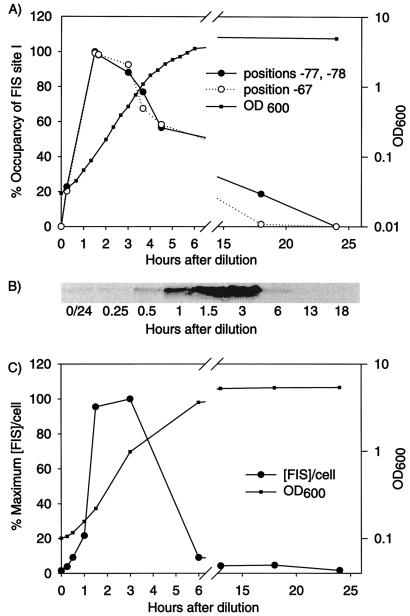
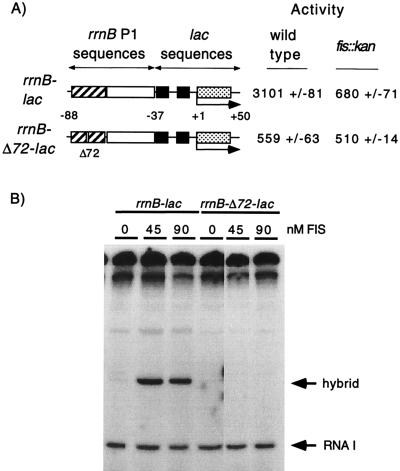
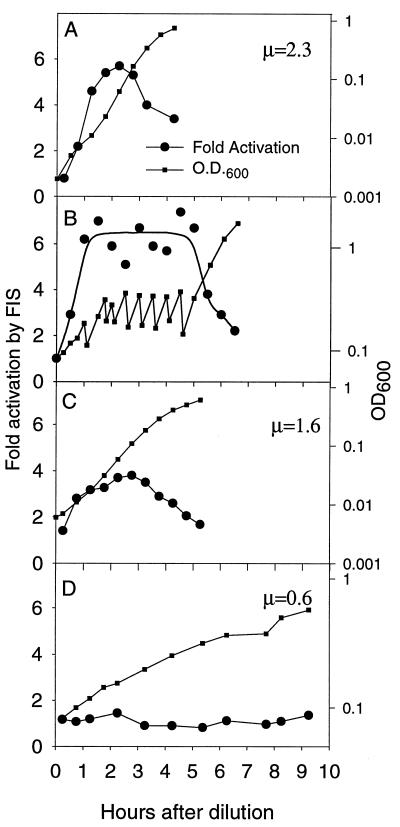
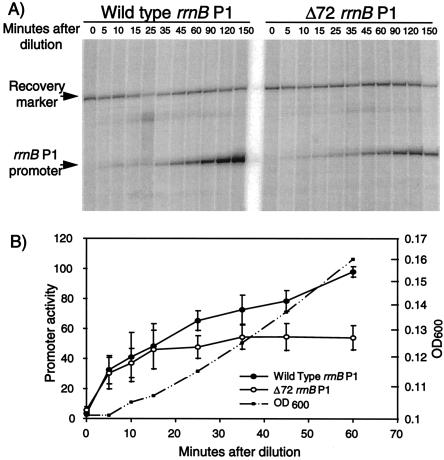
rRNA transcription in Escherichia coli is activated by the FIS protein, which binds upstream of rrnp1 promoters and interacts directly with RNA polymerase. Analysis of the contribution of FIS to rrn transcription under changing physiological conditions is complicated by several factors: the wide variation in cellular FIS concentrations with growth conditions, the contributions of several other regulatory systems to rRNA synthesis, and the pleiotropy of fis mutations. In this report, we show by in vivo footprinting and Western blot analysis that occupancy of the rrnBp1 FIS sites correlates with cellular levels of FIS. We find, using two methods of measurement (pulse induction of a FIS-activated hybrid promoter and primer extension from an unstable transcript made from rrnBp1), that the extent of transcription activation by FIS parallels the degree of FIS site occupancy and therefore cellular FIS levels. FIS activates transcription throughout exponential growth at low culture density, but rrnp1 transcription increases independently of FIS immediately following upshift, before FIS accumulates. These results support the model that FIS is one of a set of overlapping signals that together contribute to transcription from rrnp1 promoters during steady-state growth.


Figures

FIG. 1
FIG. 1
The rrnB promoter region. (A) FIS sites I, II and III, UP elements, −10 and −35 hexamers, transcription start sites (+1), and transcripts from the p1 and p2 promoters (arrows) are indicated. (B) DNA sequence of the region containing FIS sites I, II, and III in rrnBp1. G residues protected by FIS against methylation by DMS (Fig. 2 and reference 8) are indicated with asterisks. Lines indicate sequences protected by FIS against DNase I cleavage (48).
FIG. 2
FIG. 2
Binding of FIS to rrnBp1 in vitro and in vivo by DMS footprinting assays. (A) G residues protected by FIS in vitro and in vivo. Lane 1, A+G sequence marker; lanes 2 and 3, promoter fragment modified by DMS in vitro in the absence or presence of purified FIS (8); lane 4, wild-type promoter modified by DMS in vivo in a strain containing the wild-type fis gene (RLG911), 90 min (90′) after dilution of cells in fresh LB (exponential growth); lane 5, same as lane 4 except that cells were treated with DMS in stationary (Stat.) phase; lane 6, same as lane 4 except that cells (RLG921) contained the fis::kan767 allele; lane 7, same as lane 4 except that the rrnBp1 on the plasmid (pAJ4) contained the FIS site I mutation (Δ72; RLG912). The positions of G residues protected against DMS methylation by FIS in rrnB promoter sites I (−67, −77, and −78), II (−109), or III (−139, −150) are indicated. The degree of protection of particular positions is most easily evaluated by comparison to a reference band within the same lane (e.g., position −58, which is not protected by either FIS [8] or RNAP [38]). (B) Protection of FIS site residues in DMS footprints at different time points in a growth cycle. Plasmid DNA containing the wild-type rrnBp1 was modified in a wild-type (RLG911) strain at the indicated time point (100, 180, 220, or 280 min after dilution of a stationary-phase culture into fresh LB). Lanes 1 to 3, same as lanes 1 to 3 in panel A; lanes 4 to 7, in vivo footprints at the indicated times.
FIG. 3
FIG. 3
Occupancy of FIS site I and comparison with FIS levels in vivo. (A) rrnBp1 FIS site I occupancy after dilution from stationary phase. Percent occupancy was derived from protection of positions −67, −77, and −78 against DMS methylation (see the legend to Fig. 2B and Materials and Methods for details). Growth curve of a representative experiment is included. (B) FIS levels at various stages of growth. Extracts were prepared from RLG911 at the indicated times, and FIS levels were visualized on Western blots as described in Materials and Methods. The bands shown comigrated with purified FIS protein (data not shown). (C) Amounts of FIS in each band were quantified by using ImageQuant software (Molecular Dynamics) and normalized so that the maximum observed band intensity was equivalent to 100%. Growth curve of RLG911 cells sampled is shown.
FIG. 4
FIG. 4
Transcription of the rrnB-lac and rrnB-Δ72-lac hybrid promoters in vivo and in vitro. (A) Activation by FIS in vivo; residues −88 to −38 are from rrnBp1. Residues −37 to +59 are from lac and include the lac operator. Wild-type or mutant (Δ72) FIS site I (striped rectangle), the UP element (open rectangle), the −10 and −35 hexamers (filled squares), lac operator (stippled rectangle), and the transcription start site are indicated. β-Galactosidase activities at the right are from lysogens carrying the hybrid promoter-lacZ fusions (RLG1816, RLG1817, RLG1823, and RLG1824). (B) Activation by FIS in vitro. Supercoiled plasmids (pRLG1819 and pRLG1820) carrying the hybrid promoters pictured in panel A were transcribed in vitro in the presence of the indicated concentrations of purified FIS. Transcripts (about 220 nucleotides in length) from the hybrid promoter (containing the wild-type or mutant [Δ72] FIS site) and the RNA I promoter are indicated.
FIG. 5
FIG. 5
Activation of the rrnB-lac hybrid promoter by FIS as a function of growth phase in batch cultures grown in LB (A and B), M9 with glucose (C), and M9 with glycerol (D). In panel B, the cultures were kept at low density for several hours by dilution with prewarmed LB medium at 30-min intervals. Fold activation by FIS is the ratio of the β-galactosidase activities of strains RLG1816 and RLG1817 (Table 1) carrying the FIS-activated rrnB-lac and the non-FIS-activated rrnB-Δ72-lac promoter-lacZ fusions, respectively. Activity was measured after 15 min of induction by IPTG at various times after dilution of cells from stationary phase into fresh medium. Points on the graphs correspond to the end of the 15-min induction period. Peak levels of activation varied less than 15% in different experiments. Strains were isogenic and grew identically within the experiments illustrated in each panel; only one growth curve is presented for the sake of clarity. The growth rates (μ; doublings/hour) for both strains in each medium are indicated.
FIG. 6
FIG. 6
FIS-dependent activation of rrnBp1 during outgrowth from stationary phase. (A) Primer extension products from wild-type and Δ72 mutant rrnBp1 promoters (from RLG1350 and RLG1831, respectively) were measured at the indicated times during the first 60 min following dilution of cells from stationary phase into fresh LB. Equal volumes of culture were used for all time points, and the data were subsequently normalized for culture density (B). Primer extension products from rrnBp1 promoters, extending to +1, and recovery marker products (from RLG1829 cells containing an rrnBp1 promoter, extending to +50) are indicated. (B) Activities of wild-type and Δ72 rrnBp1 promoters, normalized for recovery and increasing culture density (arbitrary units). Results from four experiments similar to that shown in panel A were quantified and averaged. Error bars represent standard deviations. The growth curve (OD600) is shown from one strain in one experiment for clarity, but the growth curves from both strains in all four experiments were very similar.

References

    1. Appleman, J. A., and R. L. Gourse. Unpublished results.
    1. Bachmann B J. Linkage map of Escherichia coli K-12, edition 7. In: Neidhardt F C, Ingraham J L, Low K B, Magasanik B, Schaechter M, Umbarger H E, editors. Escherichia coli and Salmonella typhimurium: cellular and molecular biology. Washington, D.C: American Society for Microbiology; 1987. pp. 807–876.
    1. Ball C A, Osuna R, Ferguson K C, Johnson R C. Dramatic changes in FIS levels upon nutrient upshift in Escherichia coli. J Bacteriol. 1992;174:8043–8056. - PMC - PubMed
    1. Bartlett, M., T. Gaal, W. Ross, and R. L. Gourse. RNA polymerase mutants defective in the NTP-sensing mechanism for growth rate-dependent control of rRNA transcription. Submitted for publication.
    1. Bartlett M, Gourse R L. Growth rate-dependent control of the rrnB P1 core promoter in Escherichia coli. J Bacteriol. 1994;176:5560–5564. - PMC - PubMed

Publication types

MeSH terms

LinkOut - more resources