. 1998 Mar 31;95(7):3390-5.
doi: 10.1073/pnas.95.7.3390.

High-resolution restriction maps of bacterial artificial chromosomes constructed by optical mapping

Affiliations

High-resolution restriction maps of bacterial artificial chromosomes constructed by optical mapping

W Cai et al. Proc Natl Acad Sci U S A. .

Abstract

Large insert clone libraries have been the primary resource used for the physical mapping of the human genome. Research directions in the genome community now are shifting direction from purely mapping to large-scale sequencing, which in turn, require new standards to be met by physical maps and large insert libraries. Bacterial artificial chromosome libraries offer enormous potential as the chosen substrate for both mapping and sequencing studies. Physical mapping, however, has come under some scrutiny as being "redundant" in the age of large-scale automated sequencing. We report the development and applications of nonelectrophoretic, optical approaches for high-resolution mapping of bacterial artificial chromosome that offer the potential to complement and thereby advance large-scale sequencing projects.


Figures

Figure 1
Figure 1
Comparison of optical mapping restriction fragment sizing vs. PFGE. Maps of BAC 360E4 (see Fig. 5) are plotted vs. PFGE data from digitized images of stained gels. Fragment sizes less than 2 kb were determined by conventional gel electrophoresis. Gel fragments were selected for analysis when unique assignments with optical maps, within experimental error could confidently be made. Some assignments also were confirmed by double digestion. The diagonal line is drawn for reference, and error bars represent the SD on the optical sizing means (each data point represents at least 15 measurements).
Figure 2
Figure 2
Optical sizing of circular BAC clones. Circular BAC DNA molecules were mounted onto APTES surfaces and digested with NotI. Images of stained, fluorescent molecules were collected and BAC inserts were sized by comparing the fluorescence intensities of inserts (or all fragments generated within the insert) with the BAC cloning vector fragment (6.877 kb). (a) Images of four different circular BAC molecules digested with NotI: A, 150B4 (162.0 kb); B, 280A3 (195.0 kb); C 88H8 (118.0 kb); and D, 999D10 (98.8 kb). (Bar: 5 μm.) (b) BAC insert sizing data compared; optical mapping vs. PFGE. BAC sizes range from 65 kb to 200 kb and error bars represent SD on the means.
Figure 3
Figure 3
BAC contig map of human chromosome region 11p13 constructed by high-resolution optical mapping. (a) Images of individual clone molecules arranged in a contig. (Bar: 5 μm.) (b) BamHI restriction maps of corresponding clones. The average resolution of these maps is 7 kb; the smallest detectable fragment is about 1.4 kb.
Figure 4
Figure 4
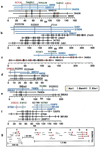
BAC contig maps of human chromosome 22, telomeric region. Contigs are divided into six groups: a, b, c, d, e and f. Contigs in light blue were constructed by hybridization-based techniques (adapted from ref. , not drawn to scale). Optical mapping results for selected clones, indicated in black lines, and formed contigs are shown below. The average resolution of these maps is about 9 kb with a minimum mapped fragment size of 0.80 kb. A putative gap in contig f was closed by optical mapping. Mapping and contig formation results are summarized (g), with red dots indicating clones that were optically mapped.
Figure 5
Figure 5
Very high-resolution map of BAC 360E4. Maps were constructed by using seven different restriction enzymes that were overlaid to maintain correct orientation (see Materials and Methods) and verified by double digestion (data not shown). The map is broken into four segments for display. The smallest mapped fragment is 0.50 kb (total insert size: 100 kb).
Figure 6
Figure 6
Plot of the false positive probability as a function of the number of enzymes and length of sequence contigs. The plot assumes the following parameters: sequence contigs of length ≈5,000–33,000 bp (corresponding to ≈3–4 to 6 genome equivalents), BAC restriction maps constructed using 6-cutter enzymes, and a fragment sizing error of 5%. The plot shows that the anchoring scheme is highly effective for contigs of 5,000 bp, when using seven or more enzymes. However, when contig length is doubled to ≈10,000 bp, only 4–5 enzymes provide similar error.

References

    1. Shizuya H, Birren B, Kim U-J, Mancino V, Slepak T, Tachiiri Y, Simon M I. Proc Natl Acad Sci USA. 1992;89:8794–8797. - PMC - PubMed
    1. Schmitt H, Kim U-J, Slepak T, Blin N, Simon M I, Shizuya H. Genomics. 1996;33:9–20. - PubMed
    1. Shizuya H, Birren B, Kim U-J, Mancino V, Slepak T, Tachiiri Y, Simon M. Proc Natl Acad Sci USA. 1992;89:8794–8797. - PMC - PubMed
    1. Cai L, Taylor J F, Wing R A, Gallagher D S, Woo S-S, Davis S K. Genomics. 1995;29:413–425. - PubMed
    1. Woo S-S, Jiang J, Gill B S, Paterson A H, Wing R A. Nucleic Acids Res. 1994;22:4922–4931. - PMC - PubMed

Publication types

LinkOut - more resources