. 1998 Mar 31;95(7):3699-702.
doi: 10.1073/pnas.95.7.3699.

Marine latitudinal diversity gradients: tests of causal hypotheses

Affiliations

Marine latitudinal diversity gradients: tests of causal hypotheses

K Roy et al. Proc Natl Acad Sci U S A. .

Abstract

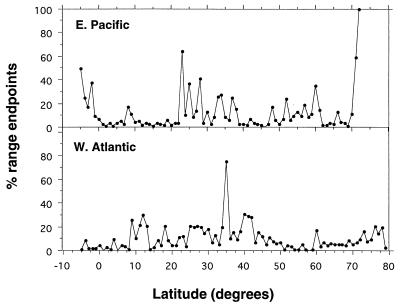
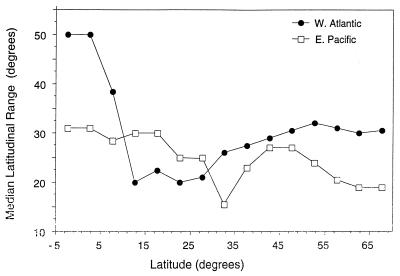
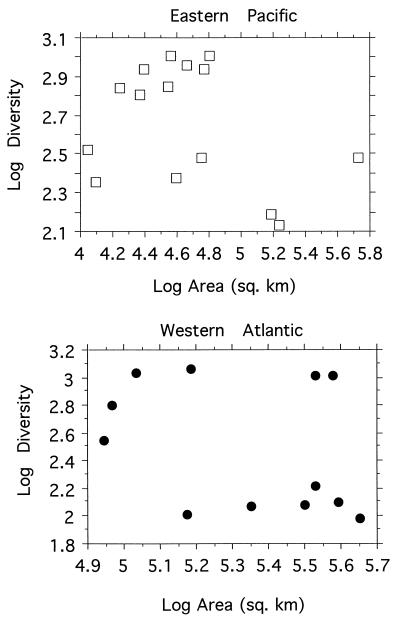
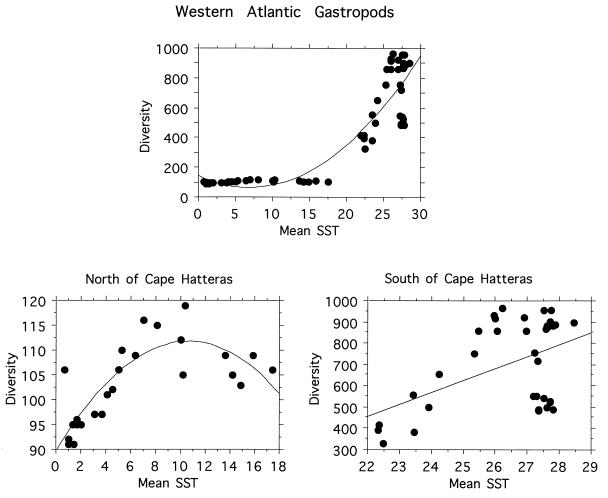
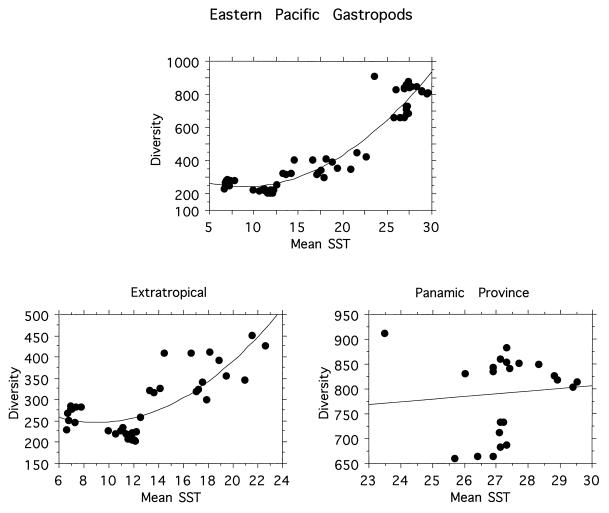
Latitudinal diversity gradients are first-order expressions of diversity patterns both on land and in the oceans, although the current hypotheses that seek to explain them are based chiefly on terrestrial data. We have assembled a database of the geographic ranges of 3,916 species of marine prosobranch gastropods living on the shelves of the western Atlantic and eastern Pacific Oceans, from the tropics to the Arctic Ocean. Western Atlantic and eastern Pacific diversities are similar, and the diversity gradients are strikingly similar despite many important physical and historical differences between the oceans. This shared diversity pattern cannot be explained by: (i) latitudinal differences in species range-length (Rapoport's rule); (ii) species-area effects; or (iii) recent geologic histories. One parameter that does correlate significantly with diversity in both oceans is solar energy input, as represented by average sea surface temperature. If this correlation is causal, sea surface temperature is probably linked to diversity through some aspect of productivity. In this case, diversity is an evolutionary outcome of trophodynamic processes inherent in ecosystems, and not just a byproduct of physical geographies.


Figures

Figure 1
Figure 1
Latitudinal diversity gradient of eastern Pacific (□) and western Atlantic (•) marine prosobranch gastropods, binned per degree of latitude. The range of a species is assumed to be continuous between its range endpoints, so diversity for any given latitude is defined as the number of species whose latitudinal ranges cross that latitude.
Figure 2
Figure 2
Latitudinal distribution of the range endpoints of marine gastropods on the eastern Pacific and western Atlantic shelves, binned per degree of altitude. Each point represents the ratio, expressed as a percentage, of the number of species ranges that end at that latitude to the total number of species present at that latitude. Latitudes with the high concentrations of range endpoints represent provincial boundaries (14). Unlike the diversity trends, species range endpoints are distributed very differently along the two marine shelves.
Figure 3
Figure 3
Median latitudinal ranges of western Atlantic (•) and eastern Pacific (□) marine gastropods. The data are binned in 5° of latitude; the value for each latitudinal segment is plotted at the middle of that segment. The median range for a particular latitudinal bin is calculated based on all species ranges that intersect that latitudinal segment.
Figure 4
Figure 4
Relationships between shelf area and diversity for eastern Pacific (Top) and western Atlantic marine prosobranchs. Spearman rank correlation for the eastern Pacific, P = 0.5; for the western Atlantic, P = 0.3. Spearman’s rho = −0.18 for the eastern Pacific, −0.31 for the western Atlantic. The relationships are not significant.
Figure 5
Figure 5
Relationships between mean annual SST and diversity for western Atlantic marine gastropods. (Upper) All data points combined. The second order polynomial regression gives a significant relationship, R2 = 0.82, P < 0.0001. (Lower, Right) The relationship south of Cape Hatteras (i.e., tropical and subtropical species). R2 = 0.24, P = 0.007. (Lower, Left) The relationship north of Cape Hatteras, R2 = 0.668, P = 0.0002. Data are spatially autocorrelated so the regression statistics should be used only for comparative purposes.
Figure 6
Figure 6
Relationships between mean annual SST and diversity for eastern Pacific marine gastropods. (Upper) All data points combined. The second order polynomial relationship gives a significant relationship, R2 = 0.92, P < 0.0001. (Lower, Right) The relationship for the Panamic province (tropical species). Relationship is not significant, R2 = 0.009, P = 0.66. (Lower, Left) The relationship for the extratropical species, R2 = 0.63, P = 0.001. Data are spatially autocorrelated so the regression statistics should be used only for comparative purposes.

References

    1. Rhode K. Oikos. 1992;65:514–527.
    1. Rosenzweig M L. J Mamm. 1992;73:715–730.
    1. Stevens G C. Am Nat. 1989;133:240–256.
    1. Turner J R G, Lennon J J, Greenwood J J D. In: Aspects of the Genesis and Maintenance of Biological Diversity. Hochberg M E, Clobert R, Barbault R, editors. Oxford: Oxford Univ. Press; 1996. pp. 199–220.
    1. Roy K, Jablonski D, Valentine J W. Proc Natl Acad Sci USA. 1994;91:8871–8874. - PMC - PubMed

Publication types

LinkOut - more resources