. 1998 Mar 31;95(7):3902-7.
doi: 10.1073/pnas.95.7.3902.

Identification and isolation of candidate human keratinocyte stem cells based on cell surface phenotype

Affiliations

Identification and isolation of candidate human keratinocyte stem cells based on cell surface phenotype

A Li et al. Proc Natl Acad Sci U S A. .

Abstract

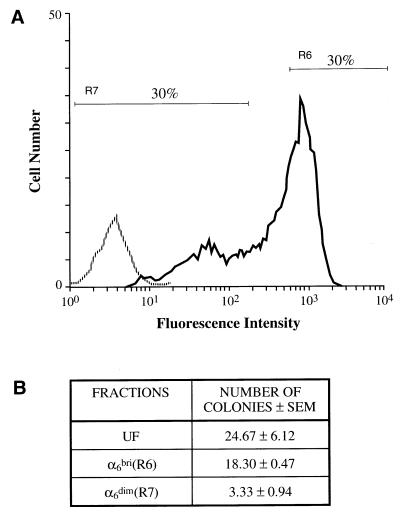
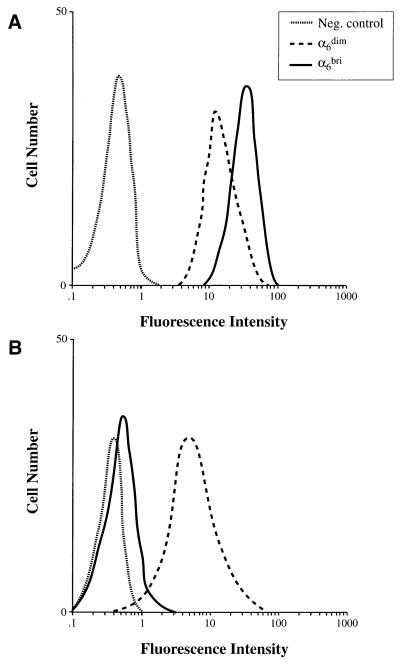
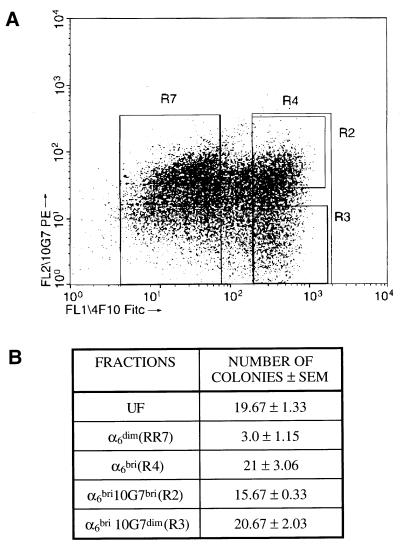
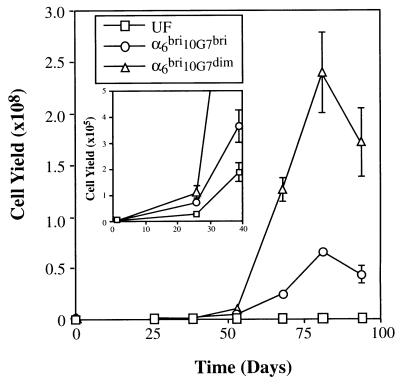
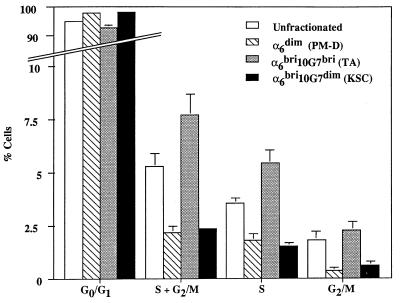
Despite the central role of human epidermal stem cells in tissue homeostasis, wound repair, and neoplasia, remarkably little is known about these cells, largely due to the absence of molecular markers that distinguish them from other proliferative cells within the germinative/basal layer. Epidermal stem cells can be distinguished from other cells in the basal layer by their quiescent nature in vivo and their greater overall proliferative capacity. In this study, we demonstrate enrichment and isolation of a subpopulation of basal epidermal cells from neonatal human foreskin based on cell surface phenotype, which satisfy these criteria. These putative stem cells are distinguished from other basal cells by their characteristic expression of high levels of the adhesion molecule alpha6, a member of the integrin family (alpha6bri), and low levels of a proliferation-associated cell surface marker recognized by recently described mAb 10G7 (10G7(dim)). We conclude that cells with the phenotype alpha6bri10G7(dim) represent the epidermal stem cell population based on the demonstration that these cells (i) exhibit the greatest regenerative capacity of any basal cells, (ii) represent a minor subpopulation (approximately 10%) of immature epidermal cells, which (iii) are quiescent at the time of isolation from the epidermis, as determined by cell cycle analysis.


Figures

Figure 1
Figure 1
Fractionation and colony-forming ability of neonatal primary human foreskin basal epidermal cells on the basis of α6 integrin expression. (A) Flow cytometric analysis of freshly isolated basal keratinocytes stained with either an anti-α6 mAb (4F10; solid line) or isotype control mAb (1A6.11; broken line) detected by a FITC-conjugated secondary antibody. Two fractions representing the upper 30% (R6) α6bri cells and the lower 30% (R7) α6dim cells were collected by FACS and cultured. (B) Colony numbers obtained from 5,000 UF, α6bri, and α6dim cells. Keratinocyte colony numbers were determined after 2 weeks in culture by staining with toluidine blue after removal of the feeder layers. The α6bri fraction consistently gave rise to greater colony numbers than the α6dim fraction, indicating that the α6bri fraction was enriched for colony forming cells. These results are typical of several replicate experiments (n = 5).
Figure 2
Figure 2
Long-term growth capacity of α6bri and α6dim cells. (A) Growth curves of UF cells and the α6bri and α6dim fractions in a representative experiment are shown. Each point represents the mean cell output ± SEM of three replicate wells obtained at each passage. The curves show that the α6bri cells consistently grew at a greater rate than the UF cells and the α6dim fraction. (Inset) Growth curves from day 0–50 to illustrate cell proliferation during this period, which is not evident on the main graph due to the scale. These results are typical of several replicate experiments (n = 5). (B) The total cell output (cumulative cell yield) from 5,000 cells of each fraction was determined at the end of the experiment when their ability to proliferate was exhausted. The total cell output of the α6bri fraction was significantly higher than the α6dim fraction and UF cells (P < 0.05), thus confirming that the α6bri population had the greatest long-term proliferative capacity. The numbers above the columns indicate mean cell yields from each fraction. The results shown represent the mean total output ± SEM of three separate experiments.
Figure 3
Figure 3
Two-color flow cytometric analysis of α6 and keratins 14 and 10 in neonatal primary human foreskin basal epidermal cells. Freshly isolated keratinocytes were fixed, permeabilized, and double labeled with anti-α6 integrin (mAb 4F10) and either (A) anti-K14 (mAb LL001) or (B) anti-K10 (mAb LHP2). Cells were analyzed for keratin expression after gating into α6bri and α6dim fractions. (A) Both these fractions were positive for the basal keratin K14, but the α6dim cells expressed lower levels of K14 than the α6bri cells. (B) The α6bri fraction was negative for the differentiation-specific keratin, K10, whereas α6dim cells were positive for this marker. Staining with appropriate isotype-matched negative control mAbs (ID4.5 and IB5) is shown (dotted lines) in each panel.
Figure 4
Figure 4
Fractionation and colony-forming ability of neonatal primary human foreskin basal epidermal cells on the basis of α6 integrin and 10G7 Ag expression. (A) Dot plot showing flow cytometric analysis of freshly isolated basal keratinocytes double-labeled with anti-α6 mAb 4F10 (FITC) and mAb 10G7 (PE) from a representative experiment. This phenotype has been observed in numerous replicate experiments (n = 25). Four fractions of cells were collected in this experiment: the α6dim population (R7 = 45.63%), the α6bri cells (R4 = 30.98%), and the latter cells subdivided on the basis of relatively high (R2 = 13.41%, α6bri10G7bri) or low levels (R3 = 9.79%, α6bri10G7dim) of 10G7 Ag expression. (B) Colony numbers obtained from 5,000 cells from each fraction at 2 weeks in culture. The α6bri10G7dim and α6bri10G7bri fractions consistently gave rise to greater colony numbers than the α6dim fraction. Importantly, no significant difference between colony numbers was obtained from the α6bri10G7dim and α6bri10G7bri fractions. These results are typical of several replicate experiments (n = 5).
Figure 5
Figure 5
Long-term growth capacity of primary human neonatal foreskin basal epidermal cells fractionated on the basis of α6 and 10G7 Ag expression. Growth curves of UF, α6bri10G7dim, and α6bri10G7bri fractions in a representative experiment (experiment II). The curves show that the α6bri10G7dim cells consistently grew at a greater rate than the UF and α6bri10G7bri cells. (Inset) Cell output at earlier time points (day 0–50) is shown and indicates that all fractions were capable of growth in culture, which is not evident on the main graph due to the scale. Data points represent mean ± SEM of three replicate wells.
Figure 6
Figure 6
Cell cycle analysis of primary basal keratinocytes fractionated on the basis of α6 and 10G7 ag expression. The UF cells show that overall, the basal layer contains about 5% of cells progressing through the S phase of the cell cycle. Analysis of fractionated cells clearly demonstrates that the majority of these actively cycling basal cells reside within the candidate TA population (α6bri10G7bri cells), whereas the candidate KSC population (α6bri10G7dim) and the postmitotic differentiating (PM-D) cells (α6dim fractions) comprise mostly quiescent cells, with relatively fewer cells in S or S/G2M phase. The results displayed are the mean ± SEM of four separate experiments.

References

    1. Potten C S. In: Stem Cells: Their Identification and Characterization. Potten C S, editor. London: Churchill Livingston; 1983. pp. 200–232.
    1. Morris R J, Fischer S M, Slaga T J. J Invest Dermatol. 1985;84:277–281. - PubMed
    1. MacKenzie I C, Bickenbach J R. Cell Tissue Res. 1985;242:551–556. - PubMed
    1. Potten C S. Int J Radiat Biol. 1986;49:257–278. - PubMed
    1. Bickenbach J R, McCutecheon J, MacKenzie I C. Cell Tissue Kinet. 1986;19:325–333. - PubMed

Publication types