. 1998 Apr;72(4):3161-8.
doi: 10.1128/JVI.72.4.3161-3168.1998.

Progression to the G1b phase of the cell cycle is required for completion of human immunodeficiency virus type 1 reverse transcription in T cells

Affiliations

Progression to the G1b phase of the cell cycle is required for completion of human immunodeficiency virus type 1 reverse transcription in T cells

Y D Korin et al. J Virol. 1998 Apr.

Abstract

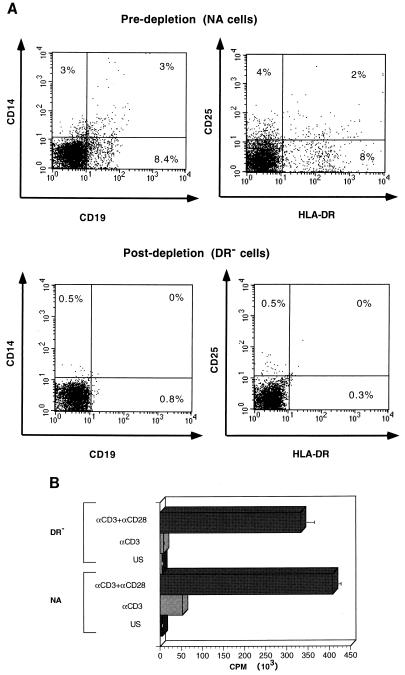
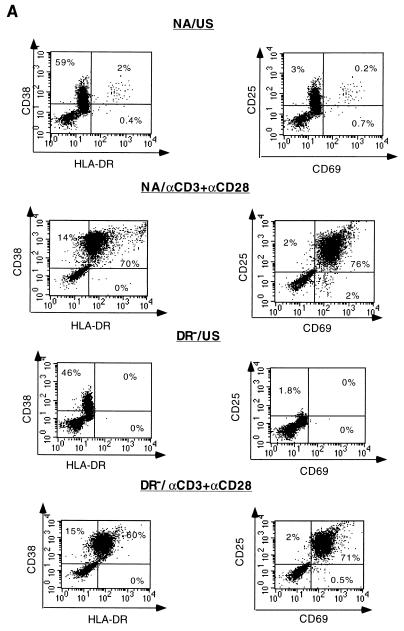
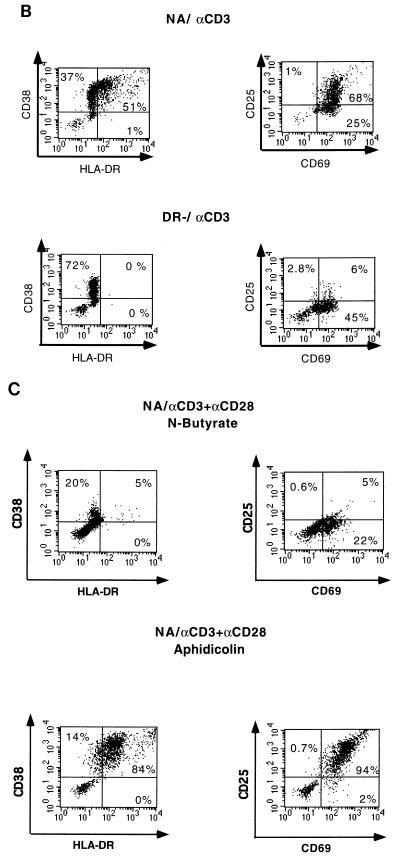
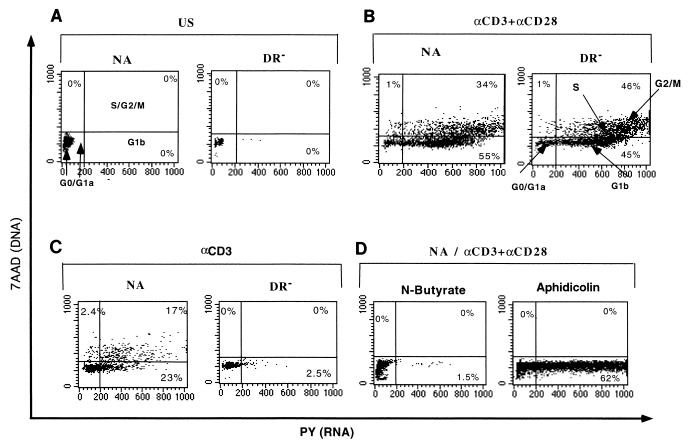
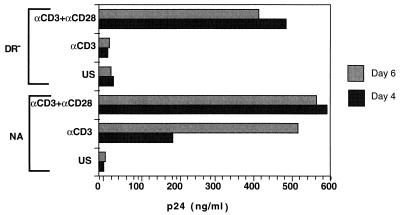
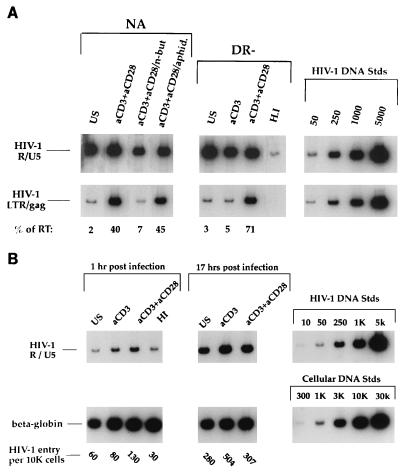
Successful infection by human immunodeficiency virus type 1 (HIV-1) requires the activation of target cells. Infection of quiescent peripheral CD4 lymphocytes by HIV-1 results in incomplete, labile, reverse transcripts. In the present study, we isolated highly purified quiescent T cells and utilized the CD3/CD28 activation pathways as well as cell cycle inhibitors to further define the role of costimulation and cell cycle progression in HIV-1 reverse transcription. Activation with alphaCD3 alone resulted in cell cycle progression into only G1a and incomplete HIV-1 reverse transcription. Costimulation through the CD28 receptor and transition into G1b was required to efficiently complete the reverse transcription process. These findings have relevance to immune activation in vivo, since lymphocytes rendered anergic by a single activation signal would be nonpermissive for productive infection with HIV-1. Importantly, these data also suggest that HIV vector-based genetic transduction strategies might be successful only in target cells that transition into the G1b phase of the cell cycle.


Figures

FIG. 1
FIG. 1
(A) Purification of lymphocyte populations. To assess the purity of the indicated populations, 5 × 10⁵ unstimulated NA and DR cells were costained with MAbs against HLA-DR, CD25, CD19, and CD14 cell markers as described in Materials and Methods. The DR cell population is 99% pure in comparison to the NA population, which contains greater than 10% cells expressing HLA-DR, as well as macrophages and B cells. (B) Requirements of costimulation for proliferation of the DR population. NA and DR cells were cultured in medium alone (US), were stimulated with 1 μg of anti-CD3 MAb per ml immobilized on GAM-coated plates (αCD3), or were costimulated with anti-CD3 plus soluble anti-CD28 each at a concentration of 1 μg/ml (αCD3+αCD28) for 3 days. Cells were harvested in triplicate and assayed for thymidine incorporation as described in Materials and Methods. Results are the averages of triplicate wells. These results are representative of more than 10 experiments.
FIG. 2
FIG. 2
Expression levels of activation markers following stimulation. (A) NA and DR unstimulated cells (US) and cells costimulated (αCD3+αCD28) for 3 days were stained with MAbs against the activation markers HLA-DR, CD38, CD69 and CD25 as described in Materials and Methods. The percentages of cells expressing the different activation markers are indicated in the corresponding quadrants. (B) Cells were stimulated with anti-CD3 alone for 3 days and stained as described for panel A. (C) NA cells were treated with the G1a/G1b cell cycle inhibitor n-butyrate or the G1b/S cell cycle inhibitor aphidicolin prior to costimulation with anti-CD3 plus anti-CD28 for 3 days and subsequently stained as described for panel A. The cells used for this experiment are the same as those used for the experiment illustrated in Fig. 1, and results are representative of more than 10 experiments.
FIG. 2
FIG. 2
Expression levels of activation markers following stimulation. (A) NA and DR unstimulated cells (US) and cells costimulated (αCD3+αCD28) for 3 days were stained with MAbs against the activation markers HLA-DR, CD38, CD69 and CD25 as described in Materials and Methods. The percentages of cells expressing the different activation markers are indicated in the corresponding quadrants. (B) Cells were stimulated with anti-CD3 alone for 3 days and stained as described for panel A. (C) NA cells were treated with the G1a/G1b cell cycle inhibitor n-butyrate or the G1b/S cell cycle inhibitor aphidicolin prior to costimulation with anti-CD3 plus anti-CD28 for 3 days and subsequently stained as described for panel A. The cells used for this experiment are the same as those used for the experiment illustrated in Fig. 1, and results are representative of more than 10 experiments.
FIG. 3
FIG. 3
Cell cycle analysis of stimulated populations. The same cell populations as those illustrated in Fig. 2 were unstimulated (US) (A), costimulated with anti-CD3 and anti-CD28 for 3 days (B), stimulated with anti-CD3 alone (C), or treated with cell cycle inhibitor n-butyrate or aphidicolin prior to costimulation (D). A total of 5 × 10⁵ cells for each condition were then stained for DNA and RNA levels for cell cycle analysis by using 7AAD and PY (47). The different cell cycle phases identified by this technique are indicated in panels A and B, and the percentage of cells in each stage of the cycle is indicated for each of the conditions.
FIG. 4
FIG. 4
Virus production in response to stimulation. DR and NA cells were infected with 1.5 μg of strain NL4-3 prior to culture. Supernatants from the DR and NA cell populations were assayed for HIV-1 p24 antigen production by ELISA on days 3 and 8 postinfection. Results are representative of four different experiments. US, unstimulated; αCD3+αCD28, costimulated with anti-CD3 and anti-CD28; αCD3, stimulated with anti-CD3 alone.
FIG. 5
FIG. 5
(A) HIV-1 reverse transcription following various stimulation treatments. Cells under the conditions described in the legends to Fig. 2 and 3 were infected with the CXCR4-tropic HIV-1 molecular clone NL4-3. At 17 h postinfection, DNA was harvested and subjected to a quantitative PCR. The primer pairs M667/AA55 (R/U5) and M667/M661 (LTR/gag) were used to detect initiation and completion of the HIV-1 reverse transcription process, respectively, in equivalent amounts of infected cell DNA. Copy numbers were determined by comparison of samples under each condition to the appropriate standard curve by utilizing radioanalytic image analysis. Percentages of initiated reverse transcripts that completed the reverse transcription process (% of RT) were determined by utilizing the following formula: %RT = (completed DNA copies/ initiated DNA copies) × 100; these values are indicated for each of the conditions. Data are representative of seven experiments and are derived from the same cells as those represented in Fig. 2 and 3. (B) HIV DNA is due to de novo reverse transcription. Highly purified DR cells were left unstimulated, were stimulated with anti-CD3 alone, or were costimulated with anti-CD3 and anti-CD28 for 3 days. Cells were infected as described in the legend to Fig. 5A and harvested and subjected to quantitative PCR at 1 and 17 h postinfection. The number of HIV-1 entry sequences per 104 cells was calculated based on total cell genomes assessed, as determined by quantitative PCR for human β-globin DNA sequences, and is indicated for each of the conditions. Standards for both HIV and cell DNAs that were amplified in parallel are shown on the right (K, thousand). US, unstimulated; aCD3, stimulated with anti-CD3 alone; aCD3+aCD28, costimulated with anti-CD3 and anti-CD28.

References

    1. Adachi A, Gendelman H E, Koenig S, Folks T, Willey R, Rabson A, Martin M A. Production of acquired immunodeficiency syndrome-associated retrovirus in human and nonhuman cells transfected with an infectious molecular clone. J Virol. 1986;59:284–291. - PMC - PubMed
    1. Akkina R K, Walton R M, Chen M L, Li Q-X, Planelles V, Chen I S Y. High-efficiency gene transfer into CD34+ cells with a human immunodeficiency virus type 1-based retroviral vector pseudotyped with vesicular stomatitis virus envelope glycoprotein G. J Virol. 1996;70:2581–2585. - PMC - PubMed
    1. Alkhatib G, Combadiere C, Broder C C, Feng Y, Kennedy P E, Murphy P M, Berger E A. CC CKR5: a RANTES, MIP-1alpha, MIP-1beta receptor as a fusion cofactor for macrophage-tropic HIV-1. Science. 1996;272:1955–1958. - PubMed
    1. Arts E J, Mak J, Kleiman L, Wainberg M A. DNA found in human immunodeficiency virus type 1 particles may not be required for infectivity. J Gen Virol. 1994;75:1605–1613. - PubMed
    1. Bukrinsky M I, Stanwick T L, Dempsey M P, Stevenson M. Quiescent T lymphocytes as an inducible virus reservoir in HIV-1 infection. Science. 1991;254:423–427. - PMC - PubMed

Publication types