. 1998 Apr 15;18(8):2856-70.
doi: 10.1523/JNEUROSCI.18-08-02856.1998.

A reluctant gating mode of glycine receptor channels determines the time course of inhibitory miniature synaptic events in zebrafish hindbrain neurons

Affiliations

A reluctant gating mode of glycine receptor channels determines the time course of inhibitory miniature synaptic events in zebrafish hindbrain neurons

P Legendre. J Neurosci. .

Abstract

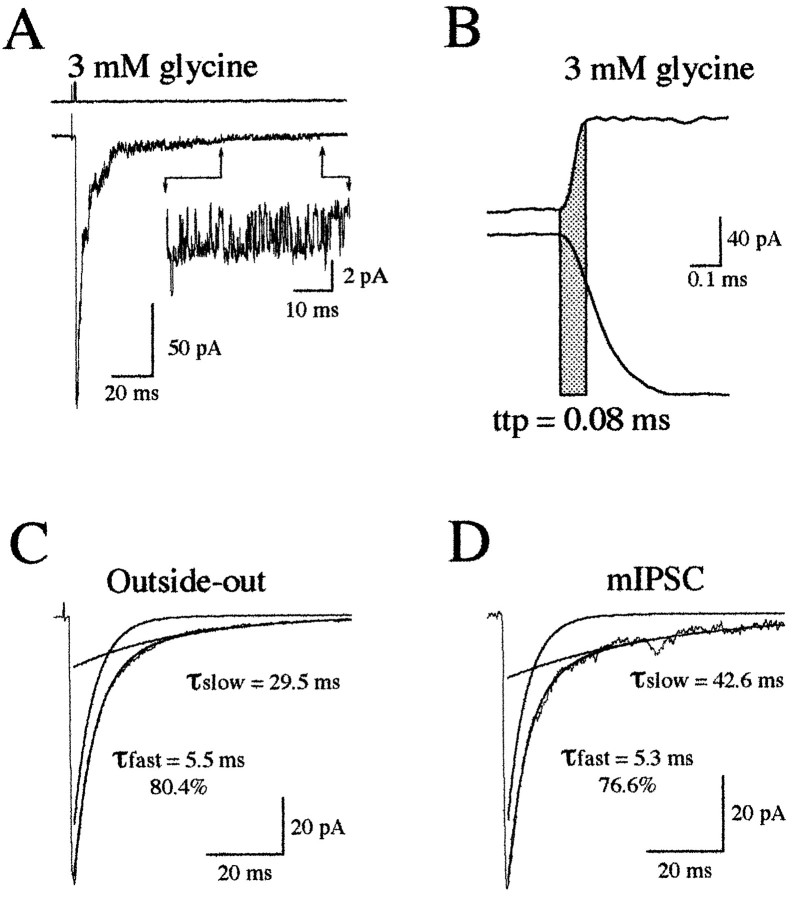
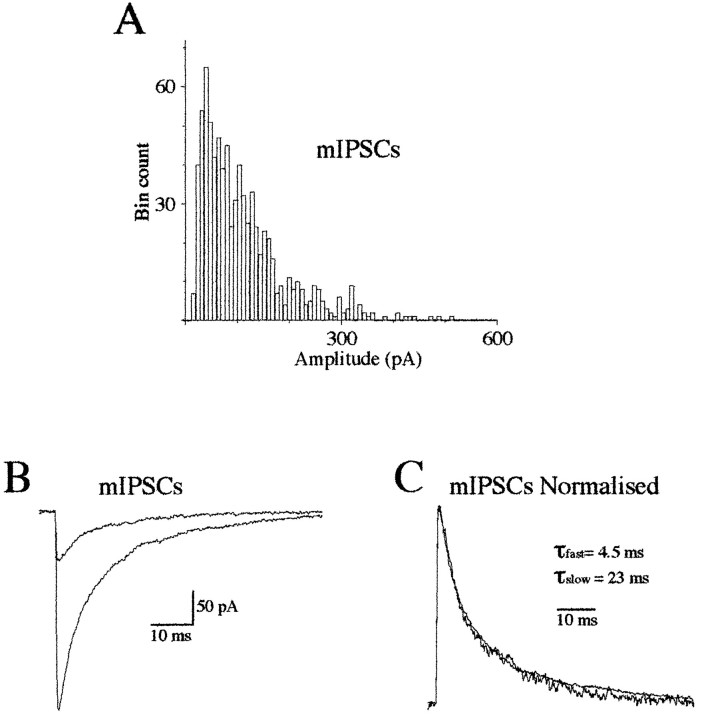
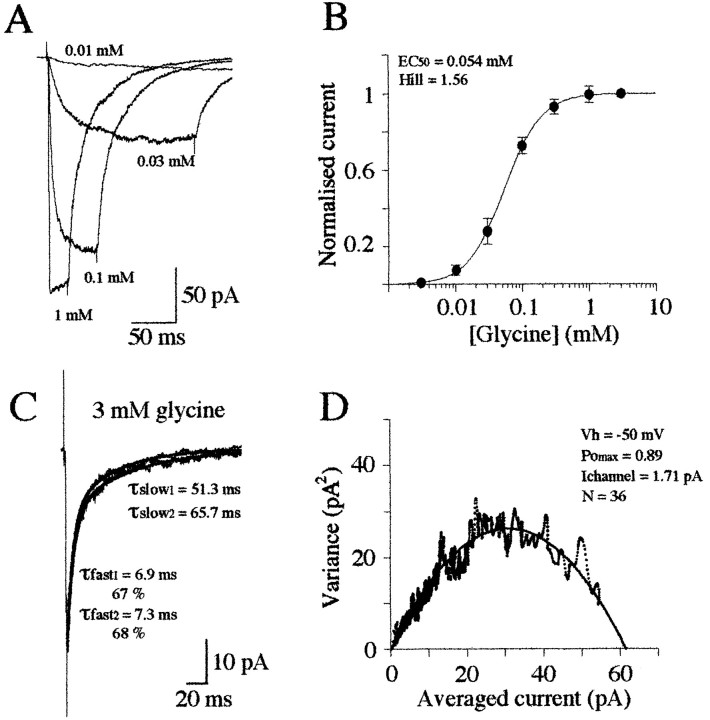
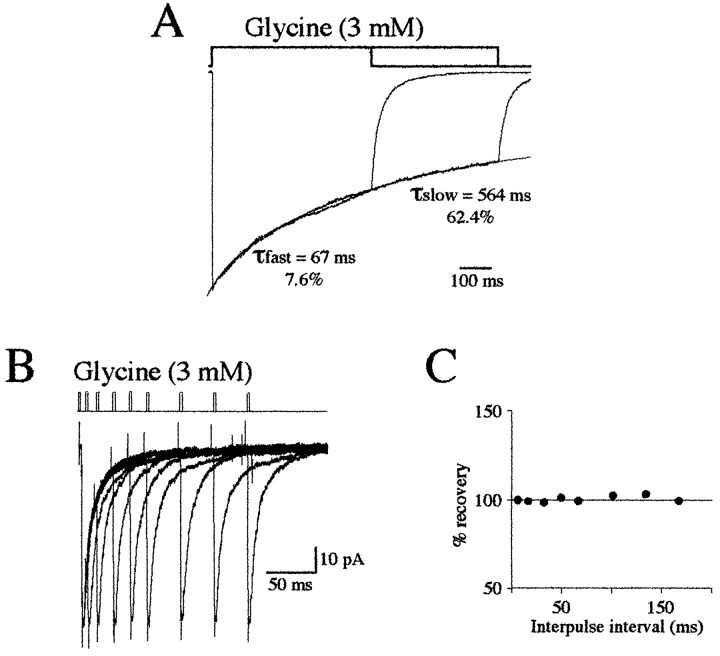
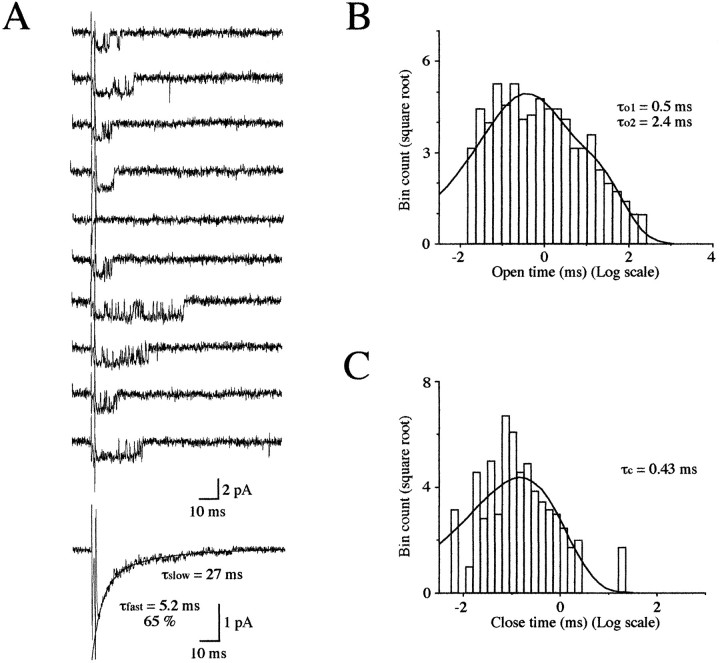
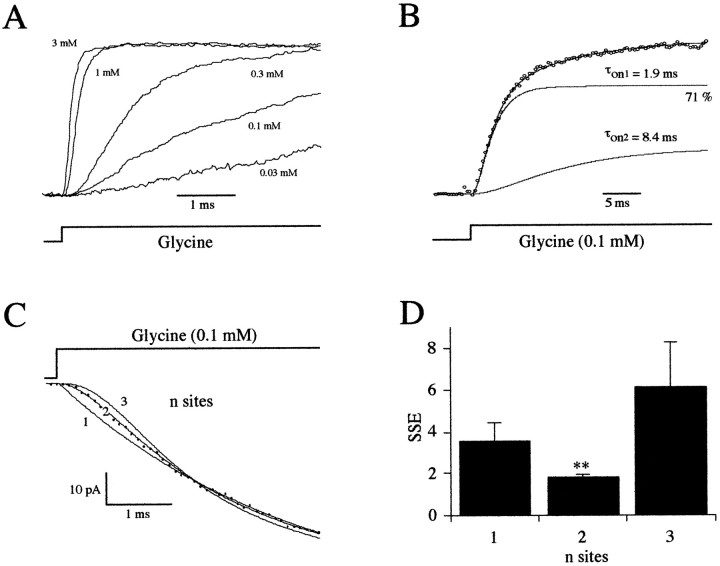
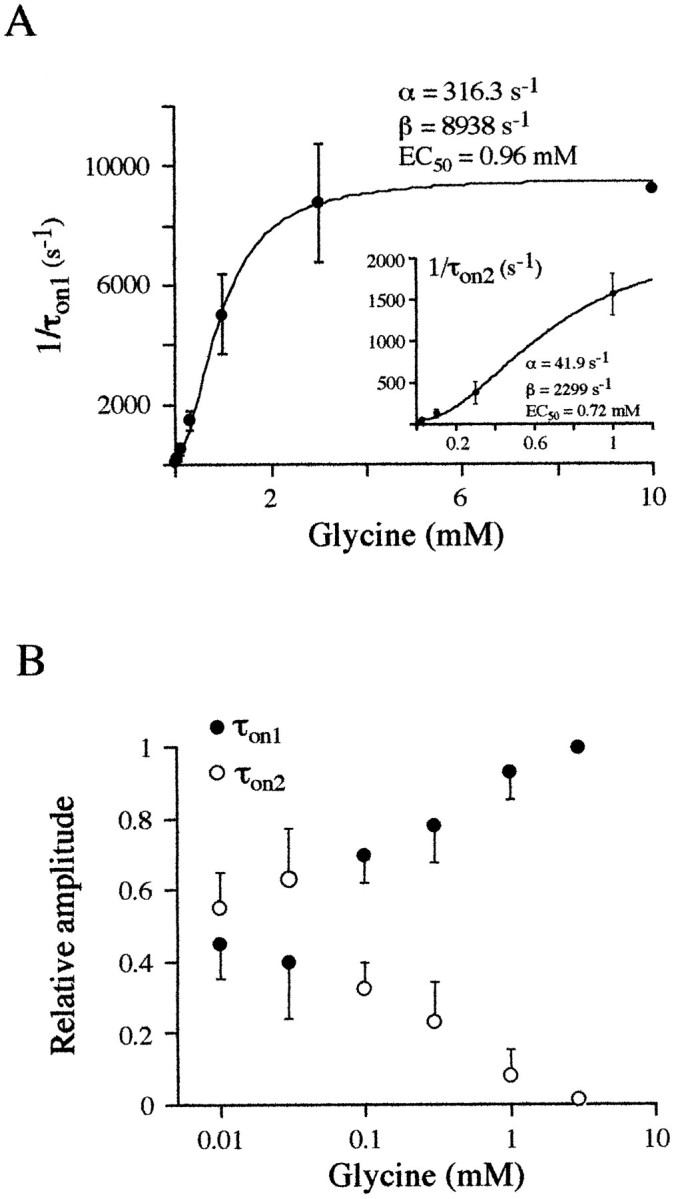
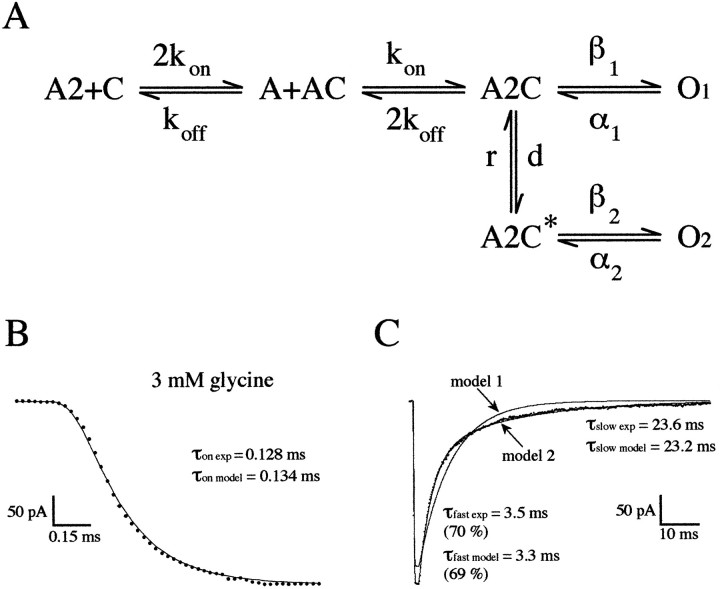
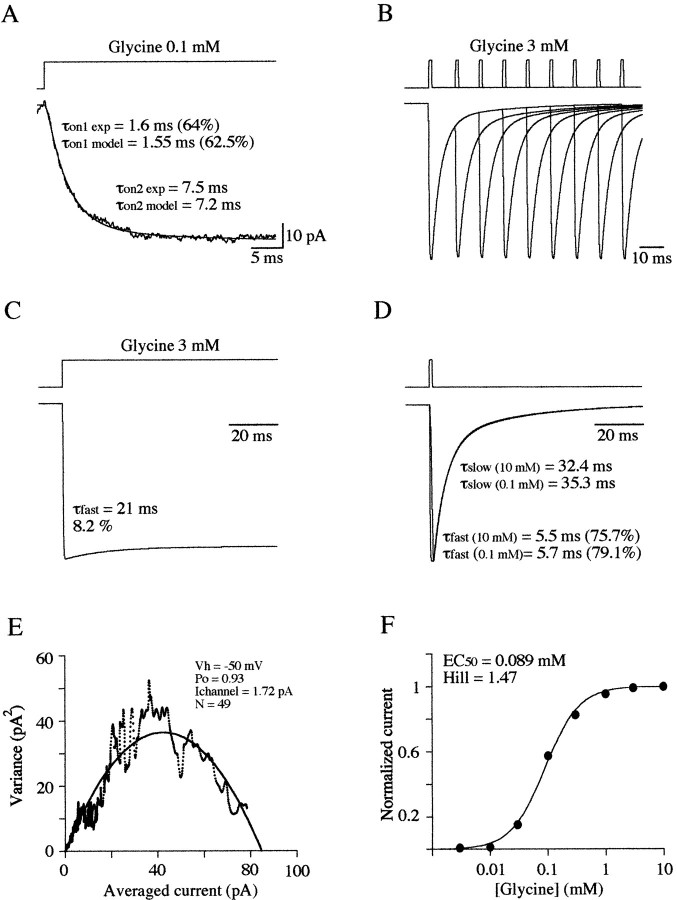
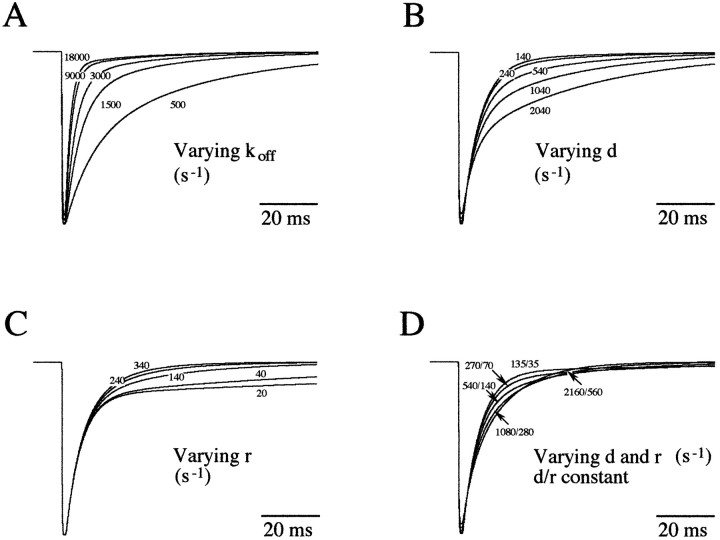
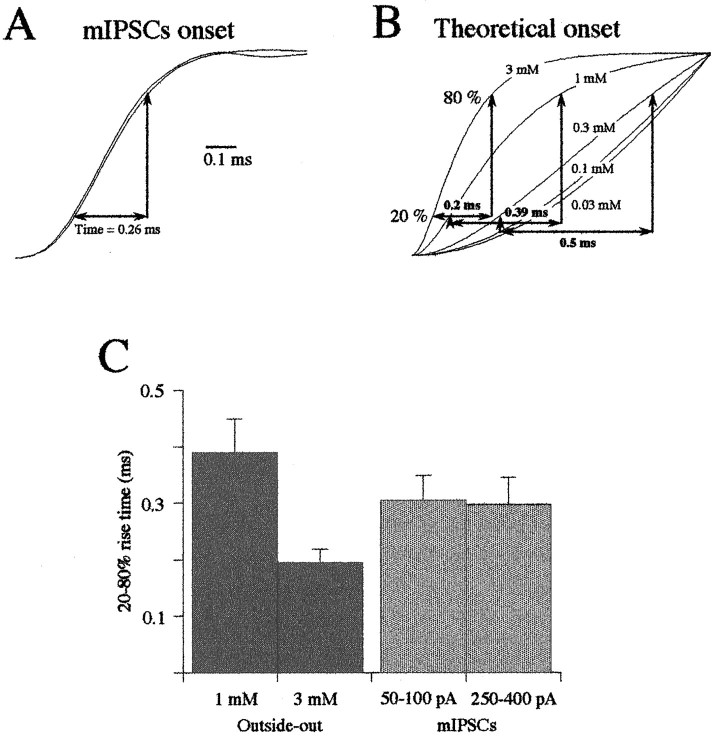
Miniature IPSCs (mIPSCs) recorded in the Mauthner (M)-cell of zebrafish larvae have a broad amplitude distribution that is attributable only partly to the functional heterogeneity of postsynaptic glycine receptors (GlyRs). The role of the kinetic properties of GlyRs in amplitude fluctuation was investigated using fast-flow application techniques on outside-out patches. Short applications of a saturating glycine concentration evoked outside-out currents with a biphasic deactivation phase as observed for mIPSCs, and they were consistent with a rapid clearance of glycine from the synaptic cleft. Patch currents declined slowly during continuous applications of 3 mM glycine, but the biphasic deactivation phase of mIPSCs cannot reflect a desensitization process because paired-pulse desensitization was not observed. The maximum open probability (Po) of GlyRs was close to 0.9 with 3 mM glycine. Analyses of the onset of outside-out currents evoked by 0.1 mM glycine are consistent with the presence of two equivalent binding sites with a Kd of O.3-O.4 mM. Activation and deactivation properties of GlyRs were better described with a kinetic model, including two binding states, a doubly liganded open state, and a reluctant gating mode leading to another open state. The 20-80% rise time of mIPSCs was independent of their amplitude and is identical to that of outside-out currents evoked by the applications of a saturating concentration of glycine (>1 mM). These results support the hypothesis that GlyR kinetics determines the time course of synaptic events at M-cell inhibitory synapses and that large mIPSC amplitude fluctuations are mainly of postsynaptic origin.


Figures

Fig. 1.
Fig. 1.
mIPSCs and glycine-evoked patch currents have a closely similar decay. A, Example of a chloride current evoked by a brief pulse (1.3 msec) of 3 mm glycine. Note that the channels open in bursts at the end of the deactivation phase (insert). B, Open tip current (top trace) recorded during a 1.3 mm step into a 10% diluted control NaCl solution. Bottom trace is rising phase of averaged patch currents (n = 15) evoked by 3 mm glycine application (1.3 msec;Vh = −50 mV). The onset of the open tip and the patch currents were aligned to compare their time courses (see Results). Note that the time to peak (ttp) of the open tip current (full exchange time = 0.08 msec) was shorter than the ttp of the patch current. C, The decay of the averaged patch currents (n = 15) evoked by a step into 3 mm glycine (1.3 msec) was accurately fitted by a biexponential curve [τfast = 5.5 msec (80.4%); τslow = 29.5 msec]. D, Example of averaged mIPSCs (50–150 pA; n = 25) with a biphasic decay with time constants of τfast = 5.3 msec (76.6%) and τslow = 42.6 msec.
Fig. 2.
Fig. 2.
Time course of mIPSCs is independent of their amplitude. A, Amplitude histogram of mIPSCs recorded on a Mauthner cell in the presence of 1 μm TTX (n = 808; bin width = 8 pA;Vh = −50 mV). B, Superimposed averaged mIPSCs of 50–150 and 250–400 pA, respectively (n = 25; Vh = −50 mV). Same cell as in A. C, Normalized averaged mIPSCs shown in B. These two miniature events have similar time courses. They were accurately fitted (not shown) with the sum of two exponential curves with τfast = 4.5 msec (56.5%) and τslow = 23 msec.
Fig. 3.
Fig. 3.
Concentration–response curve of glycine-evoked currents. A, Responses of a patch to step application of different concentrations of glycine. The duration of the application was adjusted to obtain a steady-state amplitude of the responses. Each trace represents the average of 10 responses. B, Concentration–response plot of data obtained in 11 patches. Response amplitudes were normalized to that obtained in the presence of 3 mm glycine. Each point is the average of 5–11 measurements. Data points were fitted with a single binding isotherm (see Results). C, Superimposed averaged traces of the first five and the last five responses from a set of 45 currents evoked by identical step application of 3 mm glycine (2 msec;Vh = −50 mV). D, Variance–amplitude plot computed for 45 current transients (same patch as in C). The amplitude and the variance were computed for a period of 150 msec starting at the peak of the averaged response. The curve represents the fitted model ς2 =iI − (I2/N) (see Results) with i = 1.72 pA and n= 49.
Fig. 4.
Fig. 4.
Desensitization of currents evoked by step applications of glycine. A, Averaged traces of five responses to long step applications of 3 mm glycine (0.63 and 1 sec). Desensitization to prolonged applications of glycine was described by the sum of two exponential curves and a constant term for steady-state current. Desensitization time constants were τfast = 67 msec and τslow = 564 msec. Fast desensitization was 7.6% of the total current amplitude; the slow component represented 62.4% of the total current. B, Superimposed averaged traces of responses (5 each) evoked by paired pulses of 3 mm glycine (2 msec). C, Interpulse intervals were 5, 15, 30, 50, 70, 100, 135, and 170 msec. Note that paired pulses of glycine did not produce desensitization (Vh = −50 mV).
Fig. 5.
Fig. 5.
Patch with a single GlyR activated by short step applications of 3 mm glycine. A, Example of 10 responses evoked by successive 2 msec glycine pulses (cutoff filter frequency, 3 kHz; Vh = −50 mV). Note the opening failure in epoch 5. Bottom trace: the averaged current of 26 responses has a decay that is accurately fitted by a bi-exponential curve with time constants of τfast = 5.2 msec (65%) and τslow = 27 msec. Open time (B) and closed time (C) duration histograms are shown as a function of a log intervals with the ordinate on a square root scale.
Fig. 6.
Fig. 6.
Activation time course of glycine-evoked responses. A, Averaged traces of patch currents (n = 10) showing the activation phase of the responses evoked by the application of 0.03, 0.1, 0.3, 1.0, and 3.0 mm glycine. Traces were normalized to their maximum amplitude. B, Normalized averaged current of 15 responses evoked by step applications of 0.1 mm glycine. Note that the activation phase has two components (see Results) with time constants of τon1 = 1.9 msec (71%) and τon2 = 8.4 msec. Only every 25th data point is plotted for clarity. C, First 5 msec onset of an ensemble average (n = 15 traces) after a step application of 0.1 mm glycine (•) is plotted with logistic equations for one, two, and three binding sites (see Results). Only every fifth data point is plotted for clarity. D, The sum of squared errors between the ensemble average traces and each of the three equations was calculated over the first 5 msec of the onset. For eight patches, data were better fitted with a two binding sites equation.
Fig. 7.
Fig. 7.
A, Plots of the current rising rates (1/τon) versus glycine concentration for the two rising phase components were fitted to the equation 1/τon = α + β([glycine]2/[glycine]2 + EC502) (see Results). Each point represents the averaged data of 3–11 experiments. α was 316.3 sec−1 and β was 8938 sec−1 for τon1, and they were 41.9 and 2299 sec−1 for τon2. Note that EC50of the two components has similar values: 0.96 and 0.72 mm, respectively. B, Plot of the relative proportions of the fast (•) and the slow (O) rising phase components versus concentration. The relative proportion of the slow component decreased when the concentration of glycine was increased. Each point is the average of 3–11 measurements.
Fig. 8.
Fig. 8.
A, A Markov model reproducing the gating properties of the glycine-activated channel of the zebrafish M-cell. This model possesses two sequential equivalent agonist binding steps, the doubly liganded closed state A2C providing access to a reluctant closed state (A2C*). These two closed states also provide access to two doubly liganded independent open states. B, C, Example of the activation and the decay phases of an averaged trace of 15 responses to 1.3 msec step applications of 3 mm glycine fitted by a kinetic model with two open states linked to the di-liganded closed state (model 1) and by the the kinetic model shown in A (model 2). Note that model 1 cannot properly fit experimental data (see Results). With model 2, a good fit was obtained with kon = 8 μm−1 · sec−1,koff = 2400 sec−1, α1 = 738 sec−1, β1 = 8938 sec−1, α 2 = 1300 sec−1, β2 = 2610 sec−1, d = 990 sec−1, and r = 180 sec−1.
Fig. 9.
Fig. 9.
A, This model predicts two components of the activation phase of responses evoked by step into <1 mm glycine. In this example the optimum fit of the averaged trace of 15 responses to long step application of 0.1 mmglycine was obtained with kon = 7 μm−1 · sec−1,koff = 3600 sec−1, α1 = 680 sec−1, β1 = 8938 sec−1, α 2 = 1300 sec−1, β2 = 3180 sec−1, d = 814 sec−1, and r = 270 sec−1. The experimental trace had two rising phase components with τon1 = 1.6 msec (64%) and τon2 = 7.5 msec (see Results for the fit procedure and the equations used). In this example, the model predicts rising time constants of τon1= 1.55 msec (62.5%) and τon2 = 7.2 msec.B, Simulated paired-pulse responses generated by the (Figure legend continued) kinetic model. Rate parameters used werekon = 5 μm−1 · sec−1,koff = 1500 sec−1, α1 = 680 sec−1, β1 = 8938 sec−1, α 2 = 1300 sec−1, β2 = 3180 sec−1, d = 540 sec−1, and r = 140 sec−1). Note that desensitization does not occur.C, This model predicts a small desensitization component during steady-state application of glycine. D, It also generates responses with a concentration-independent decay time.E, Maximum open probability of simulated responses ([glycine] = 3 mm; N = 44,ichannel = 2.2 pA). The variance–amplitude plot was computed for 15 generated transient currents. The fit of this plot gave a ichannel of 1.72 pA, anN of 49, and a Pomaxof 0.93. F, Concentration–response curve of simulated glycine-evoked currents. Fit of the theoretical data points using a single binding isotherm gave an EC50 value (0.089 mm) and a Hill coefficient (1.47) in good agreement with the experimental results.
Fig. 10.
Fig. 10.
The model parameters were used (see Fig.9B) to examine the effect of varying the unbinding ratekoff, the rate d and the rate r on the deactivation phase, and the amplitude of glycine-evoked responses. A, Reducingkoff dramatically decreased the response duration. B, C, Reducing the rate constant d or r primarily affects the slow decay phase component. D, Increasing rates constantd and r, thed/r ratio being constant, induces a progressive lost of the biphasic shape of the deactivation phase. Varying these binding rates, however, had little or no effect on the response amplitudes.
Fig. 11.
Fig. 11.
Estimation of the peak concentration of glycine released at inhibitory synapses. A, Example of the rising phase of normalized averaged traces of 25 mIPSCs of small (50–150 pA) and large (250–450 pA) amplitudes. Same data as shown in Figure 2B,C. Note that the two rising phases are fast (20–80% rise time = 0.26 msec) and nearly identical, being consistent with the fact that mIPSCs amplitude variations are independent of the peak concentration of glycine released (filter cutoff frequency = 10 kHz). B, Theoretical normalized activation phases of transient currents evoked by 1 msec step applications of various concentrations of glycine (3, 1, 0.3, 0.1, and 0.03 mm). Each trace was obtained according to the averaged rise rates shown in Figure 8. C, The comparison of the 20–80% rise times of small and large mIPSCs (n = 10 cells) to the 20–80% rise times of patch responses evoked by a short application of 1 and 3 mmglycine (n = 10) suggests that the peak concentration of glycine released at M-cell inhibitory synapses is between 1 and 3 mm.

References

    1. Akaike N, Kaneda M. Glycine-gated chloride current in acutely isolated rat hypothalamic neurons. J Neurophysiol. 1989;62:1400–1409. - PubMed
    1. Alvarez FJ, Dewey DE, Harrington DA, Fyffe REW. Cell-type specific organization of glycine receptor clusters in the mammalian spinal cord. J Comp Neurol. 1997;379:150–170. - PubMed
    1. Ankri N, Legendre P, Faber DS, Korn H. Automatic detection of spontaneous synaptic responses in central neurons. J Neurosci Methods. 1994;52:87–100. - PubMed
    1. Bean BP. Neurotransmitter inhibition of neuronal calcium currents by changes in channel voltage dependence. Nature. 1989;340:153–156. - PubMed
    1. Becker CM, Hoch W, Betz H. Glycine receptor heterogeneity in rat spinal cord during postnatal development. EMBO J. 1988;7:3717–3726. - PMC - PubMed

Publication types

MeSH terms

LinkOut - more resources