

Differences in the frequency of cytokine-producing cells in antigenemic and nonantigenemic individuals with bancroftian filariasis
- PMID: 9529056
- PMCID: PMC108063
- DOI: 10.1128/IAI.66.4.1377-1383.1998
Differences in the frequency of cytokine-producing cells in antigenemic and nonantigenemic individuals with bancroftian filariasis
Abstract
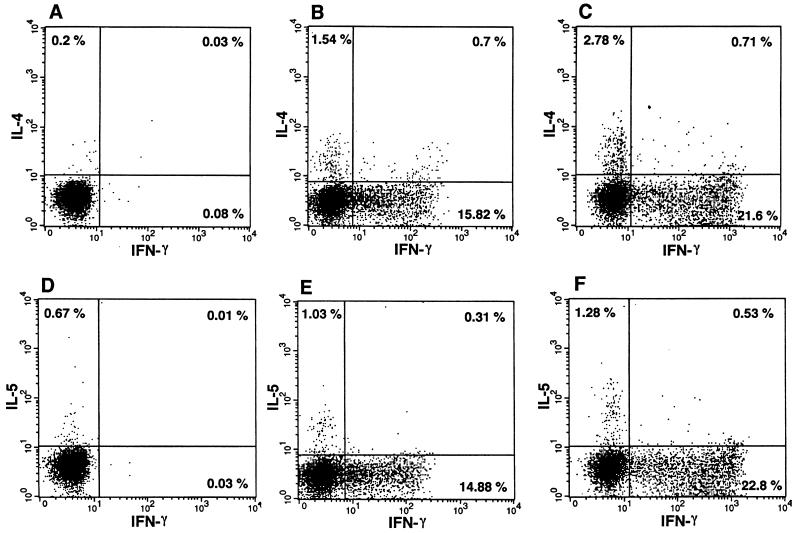
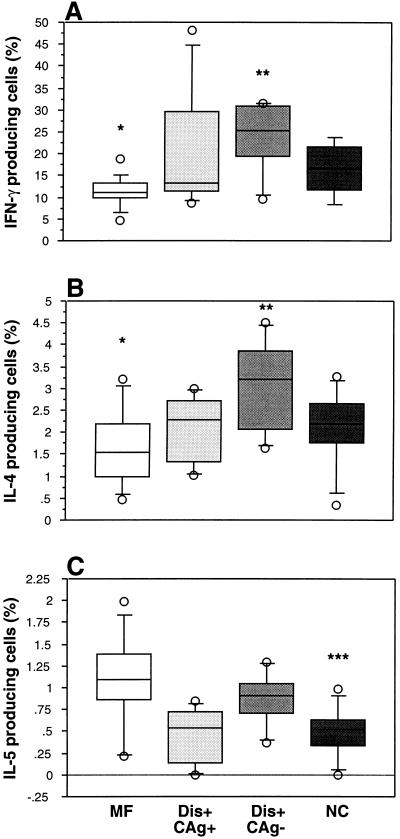
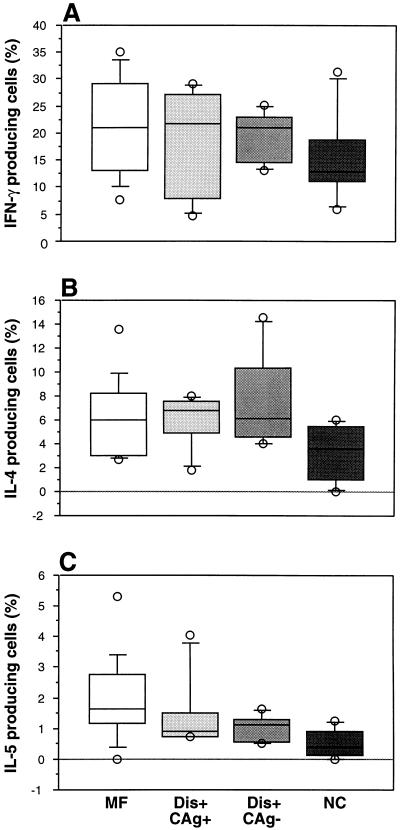
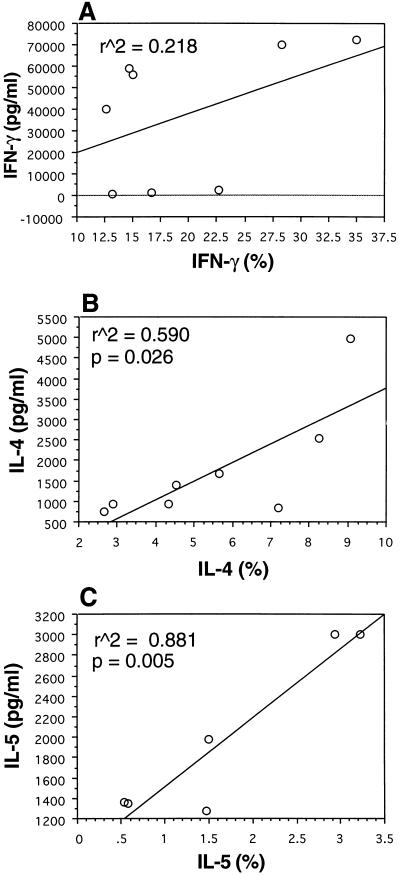
Individuals with clinical manifestations of lymphatic filariasis may be currently infected or not. Twenty-five individuals from a Wuchereria bancrofti-endemic area of Brazil were classified as being asymptomatic microfilaremic individuals, antigenemic individuals with clinical filariasis, or nonantigenemic individuals with clinical filariasis. Intracellular cytokine staining of mitogen-stimulated peripheral blood mononuclear cells (PBMC) showed that the frequency of either gamma interferon (IFN-gamma)- or interleukin-4 (IL-4)-producing cells was higher in the nonantigenemic individuals with clinical filariasis than in the asymptomatic microfilaremic individuals (geometric means, 22.1 versus 10.7% [P = 0.02] and 2.9 versus 1.4% [P = 0.01], respectively). When the asymptomatic microfilaremic individuals and antigenemic individuals with clinical filariasis were grouped together to constitute all actively infected individuals, the frequency of IFN-gamma-producing cells was also lower than in the nonantigenemic individuals with clinical filariasis (P = 0.04). Likewise, the frequency of IL-4-producing cells in the actively infected individuals was also lower than in the nonantigenemic individuals with clinical filariasis (P = 0.02). No differences in the frequency of IFN-gamma-, IL-4-, or IL-5-producing cells in purified CD4 T lymphocytes were found among the groups. These findings suggest that the presence of antigenemia, which is an indicator of current active infection, is closely associated with the frequency of IFN-gamma- and IL-4-producing cells in lymphatic filariasis. The differences found in the frequency of cytokine-producing cells among the three groups appear to be due to a subset of cells other than CD4 T cells.
Figures
References
-
- Albuquerque M F M, Marzochi M C, Sabroza P C, Braga M C, Padilha T, Silva M C M, Silva M R F, Schindler H C, Maciel M A, Souza W, Furtado A F. Bancroftian filariasis in two urban areas of Recife, Brazil: pre-control observations on infection and disease. Trans R Soc Trop Med Hyg. 1995;89:373–377. - PubMed
-
- al-Rayes H, Pachas W, Mirza N, Ahern D J, Geha R S, Vercelli D. IgE regulation and lymphokine patterns in aging humans. J Allergy Clin Immunol. 1992;90:630–636. - PubMed
-
- Chanteau S, Glaziou P, Luquiaud P, Plichart C, Moulia-Pelat J P, Cartel J L. Og4C3 circulating antigen, anti-Brugia malayi IgG and IgG4 titers in Wuchereria bancrofti infected patients, according to their parasitological status. Trop Med Parasitol. 1994;45:255–257. - PubMed
-
- de Almeida A B, Maia e Silva M C, Maciel M A, Freedman D O. The presence or absence of active infection, not clinical status, is most closely associated with cytokine responses in lymphatic filariasis. J Infect Dis. 1996;173:1453–1459. - PubMed
Publication types
MeSH terms
Substances
Grants and funding
LinkOut - more resources
Full Text Sources
Research Materials
