. 1998 Apr;9(4):957-75.
doi: 10.1091/mbc.9.4.957.

Fluid-phase markers in the basolateral endocytic pathway accumulate in response to the actin assembly-promoting drug Jasplakinolide

Affiliations
Free PMC article

Fluid-phase markers in the basolateral endocytic pathway accumulate in response to the actin assembly-promoting drug Jasplakinolide

W Shurety et al. Mol Biol Cell. 1998 Apr.
Free PMC article

Abstract

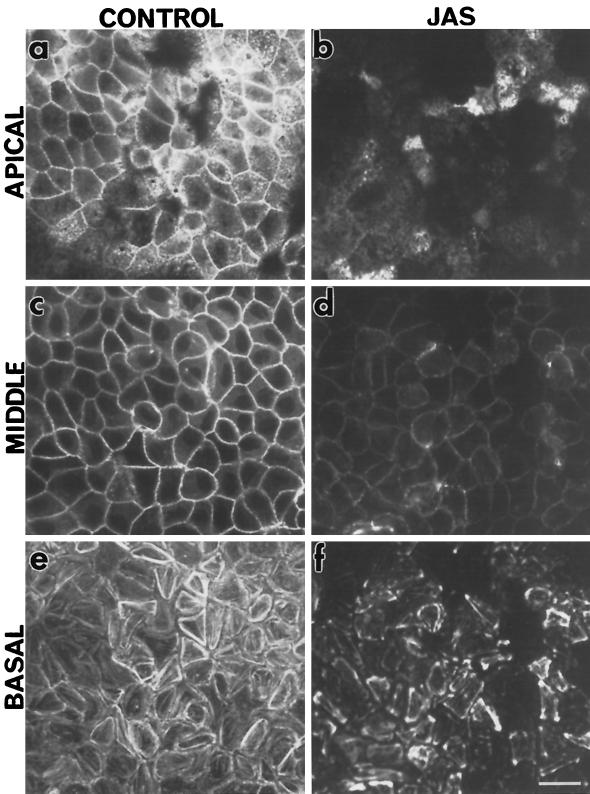
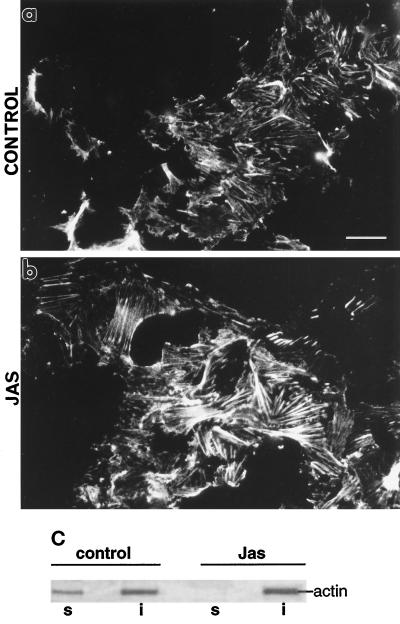
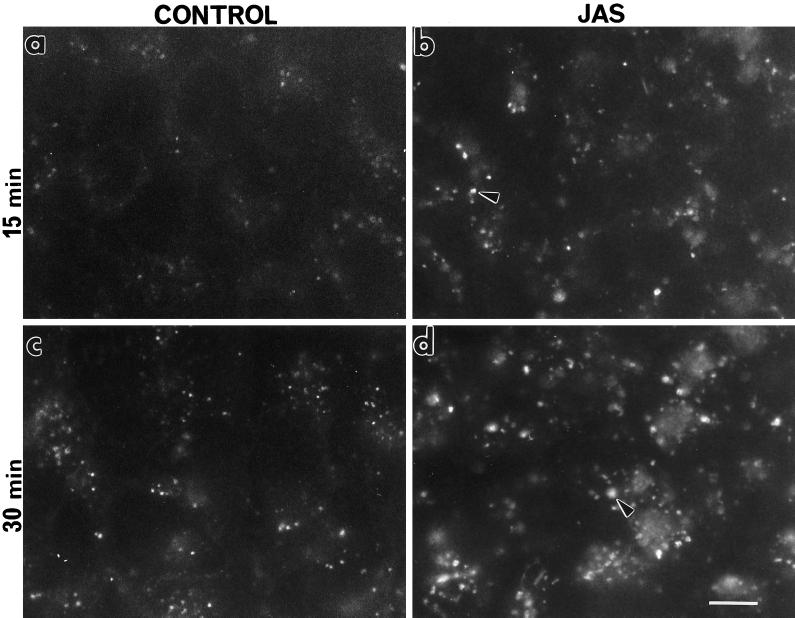
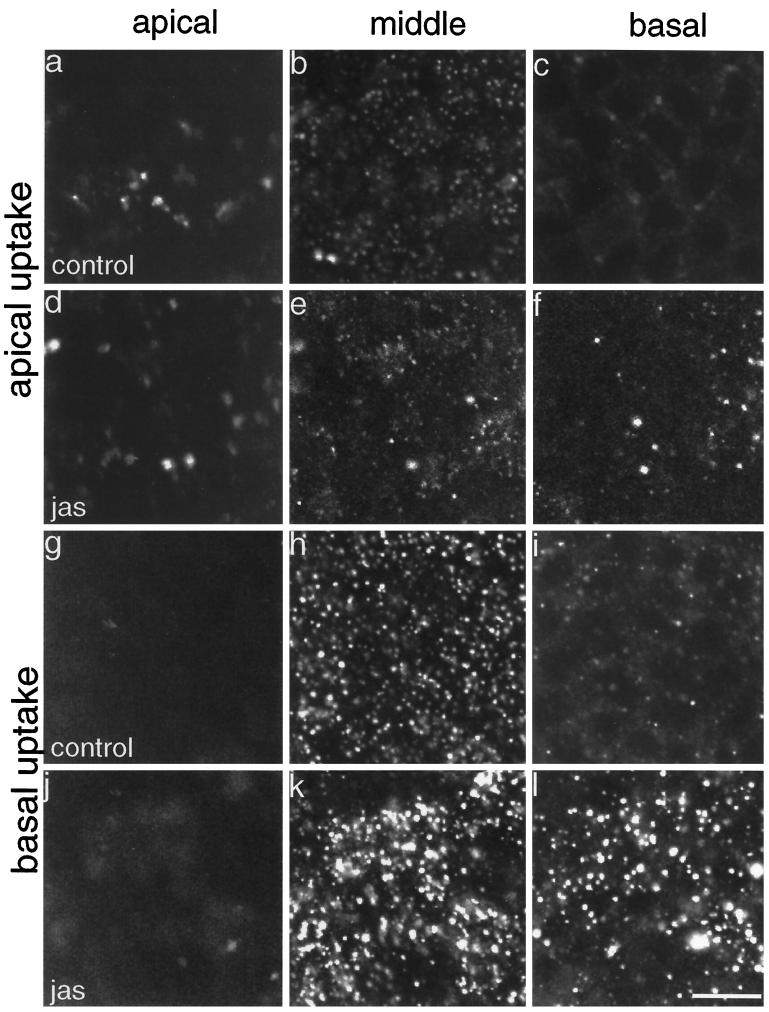
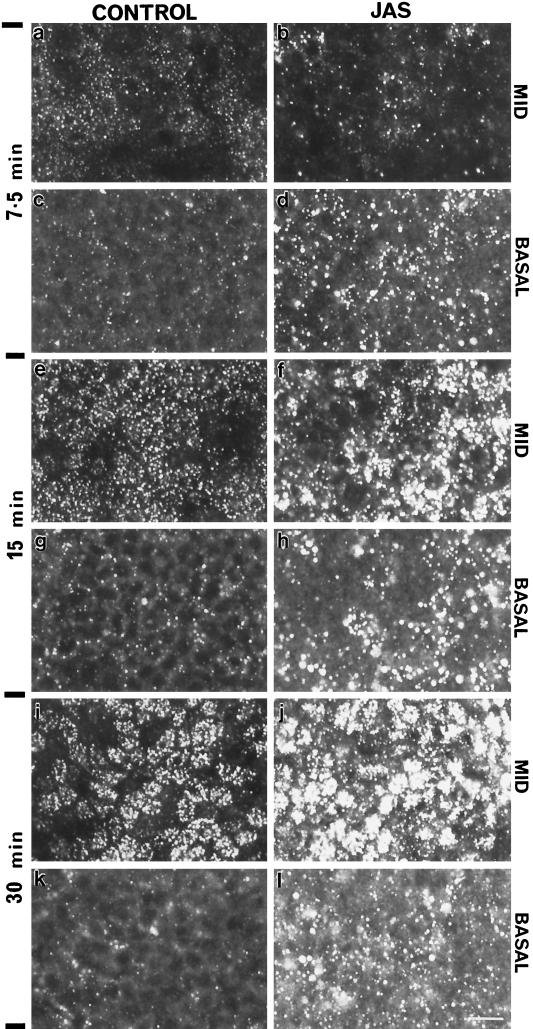
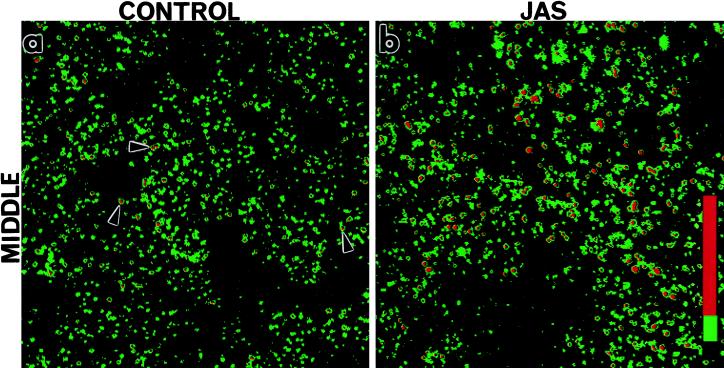
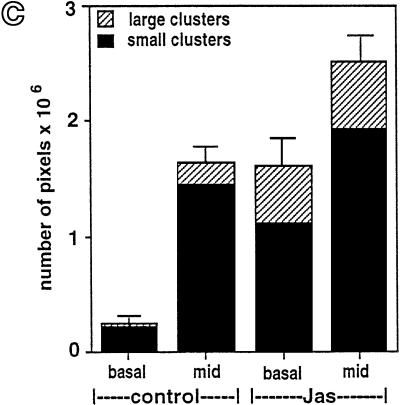
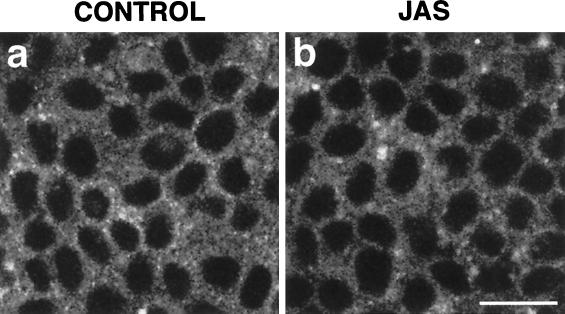
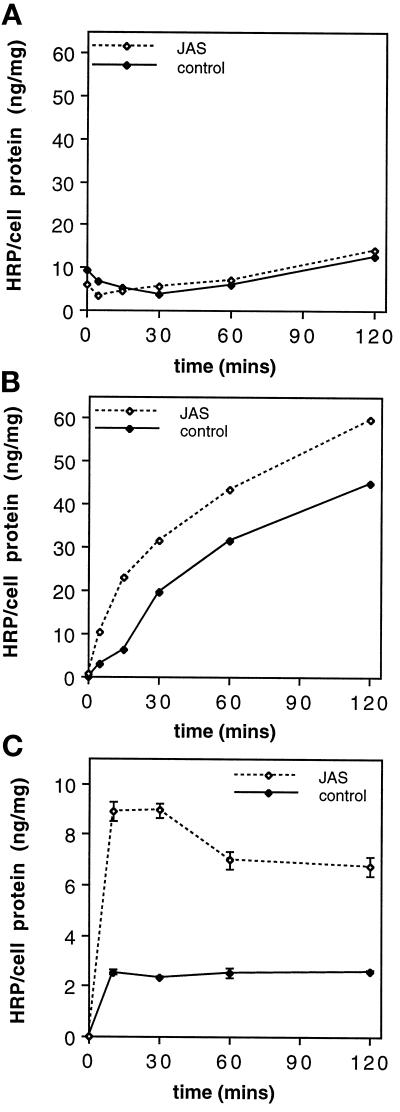
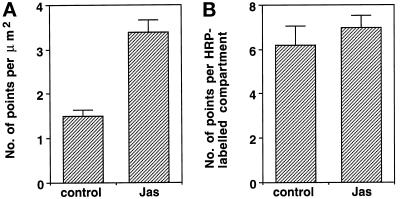
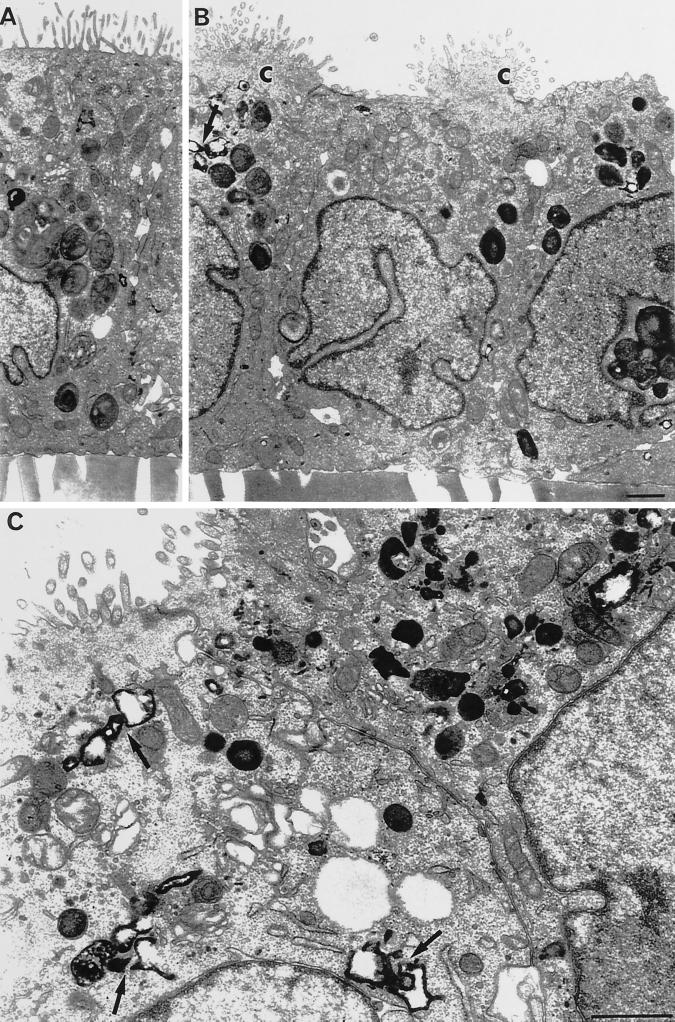
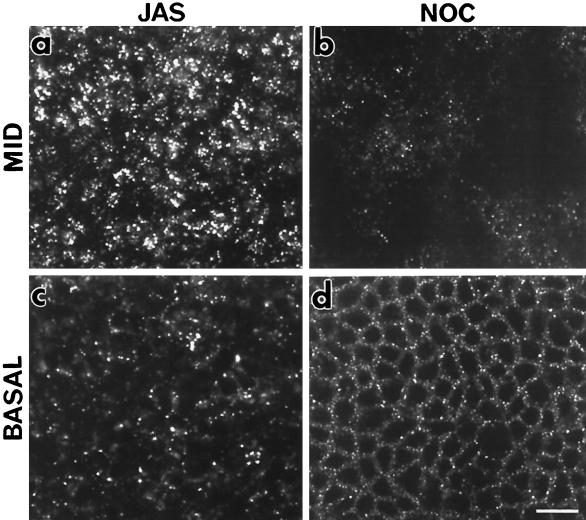
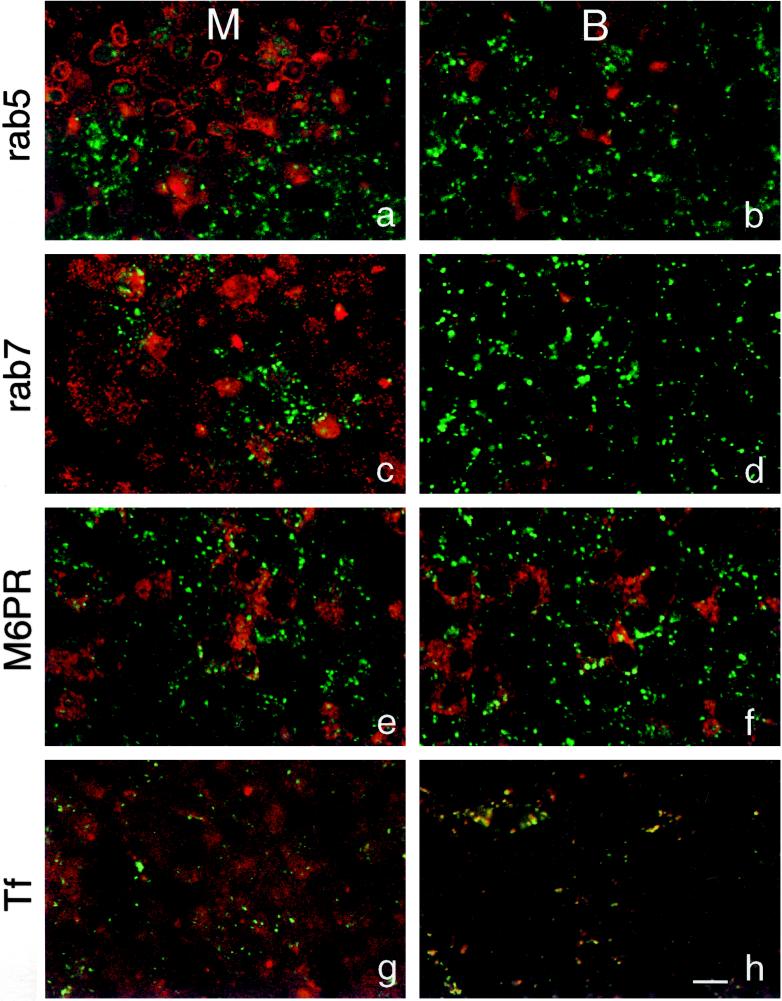
To investigate the role of filamentous actin in the endocytic pathway, we used the cell-permeant drug Jasplakinolide (JAS) to polymerize actin in intact polarized Madin-Darby canine kidney (MDCK) cells. The uptake and accumulation of the fluid-phase markers fluorescein isothiocyanate (FITC)-dextran and horseradish peroxidase (HRP) were followed in JAS-treated or untreated cells with confocal fluorescence microscopy, biochemical assays, and electron microscopy. Pretreatment with JAS increased the uptake and accumulation of fluid-phase markers in MDCK cells. JAS increased endocytosis in a polarized manner, with a marked effect on fluid-phase uptake from the basolateral surface but not from the apical surface of polarized MDCK cells. The early uptake of FITC-dextran and HRP was increased more than twofold in JAS-treated cells. At later times, FITC-dextran and HRP accumulated in clustered endosomes in the basal and middle regions of JAS-treated cells. The large accumulated endosomes were similar to late endosomes but they were not colabeled for other late endosome markers, such as rab7 or mannose-6-phosphate receptor. JAS altered transport in the endocytic pathway at a later stage than the microtubule-dependent step affected by nocodazole. JAS also had a notable effect on cell morphology, inducing membrane bunching at the apical pole of MDCK cells. Although other studies have implicated actin in endocytosis at the apical cell surface, our results provide novel evidence that filamentous actin is also involved in the endocytosis of fluid-phase markers from the basolateral membrane of polarized cells.


Figures

Figure 1
Figure 1
Actin staining in JAS-treated cells. FITC-phalloidin labeling on control and JAS-treated polarized MDCK cells. Confocal microscopy of FITC-phalloidin labeling in nontreated MDCK cells (a, c, and e) and cells pretreated with 1 μM JAS for 45 min at 37°C (b, d, and f). Typical patterns of labeling for F-actin in the apical terminal web (a), around the midcell cortical web (c), and in stress fibers at the base of cells (e) were seen in control cells. JAS competed with phalloidin binding sites resulting in less-intense labeling at all levels (b, d, and f) of the cell monolayer. Bar, 10 μm.
Figure 2
Figure 2
Actin polymerization induced by JAS treatment. (a and b) FITC-phalloidin labeling of actin bundles attached to the cytoplasmic face of ACPs remaining stuck to coverslips after sonication of the MDCK cells. (a) Control cells have labeling of fine bundles of stress fibers. (b) After JAS treatment, there were thicker more-prominent actin bundles. Bar, 10 μm. (c) Proteins in detergent-soluble and -insoluble fractions of control and JAS-treated MDCK cells were electrophoresed on SDS-PAGE gels and stained with 0.1% Coomassie blue. Left, a 42-kDa band representing actin is present in both the Triton X-100-soluble (lane s) and -insoluble (lane i) fractions of nontreated MDCK cells. Right, the actin band has disappeared from the soluble fraction of JAS-treated cells (lane s) and all of the recovered actin is in the insoluble fraction (lane i), consistent with a conversion to F-actin.
Figure 3
Figure 3
FITC-dextran uptake in preconfluent MDCK cells. Control and JAS-pretreated cells, grown on coverslips, were incubated with FITC-dextran for 15 min or 30 min at 37°C, and the endocytosed marker was visualized by epifluorescence microscopy. After both 15 min and 30 min uptake in JAS-pretreated cells, there was an increase in the number and size of fluorescently labeled compartments (arrows) (b and d) in comparison to those seen in control cells (a and c). Bar, 10 μm.
Figure 4
Figure 4
FITC-dextran uptake in polarized cells. Control and JAS-pretreated cells, grown on filters, were incubated with FITC-dextran added to either the apical or basolateral chamber for 15 min. Confocal microscopy shows endocytosed label at designated levels representing apical, middle, and basal levels of the cell monolayer. Little label was endocytosed from the apical side of either control (a–c) or JAS-treated (d–f) cells. A large amount of FITC-dextran was taken up from the basal medium and it was sequestered in structures at the basal and middle planes of control (h and i) and JAS-treated (k and l) cells. There was a marked increase in the number and size of labeled endocytic compartments in both the middle (k) and basal (l) planes after JAS treatment. Bar, 10 μm.
Figure 5
Figure 5
Kinetics of FITC-dextran uptake from the basal side of MDCK cells. The middle and basal planes of control and JAS-treated MDCK cells were examined by confocal microscopy after uptake of FITC-dextran for 7.5, 15, and 30 min. JAS-pretreated induced an increase in the number and size of labeled compartments at the basal region at all times (d, h, and l) compared with control cells (c, j, and k). JAS also produced an increase in labeled compartments in the middle region of the monolayer at the later times of 15 (f) and 30 min (j), when compared with control cells after the same uptake times (e and i). Bar, 10 μm.
Figure 6
Figure 6
Image analysis of FITC-dextran basolateral uptake in polarized MDCK cells. Control and JAS-pretreated cells were incubated with FITC-dextran present in the basolateral chamber for 15 min. FITC-dextran-labeled structures at the middle region (e.g., see Figure 5, e and f) were separated into two populations according to relative fluorescence intensity measured with SOM software. Small low-intensity endosome clusters (green) and large high-intensity endosome clusters (red) are differentiated in this colored image. Small endosome clusters were present in both control (a) and JAS-treated cells (b), whereas large endosome clusters were clearly more abundant in JAS-treated cells (b). (c) Quantification of relative fluorescence intensities showed that JAS treatment induced an approximately sixfold increase in uptake into the basal region and a significant increase in uptake into the middle region. In control cells, large endosome clusters were present mostly in the middle region, whereas in JAS-treated cells, the number of both types of clusters is significantly increased at the basal and middle regions.
Figure 6
Figure 6
Image analysis of FITC-dextran basolateral uptake in polarized MDCK cells. Control and JAS-pretreated cells were incubated with FITC-dextran present in the basolateral chamber for 15 min. FITC-dextran-labeled structures at the middle region (e.g., see Figure 5, e and f) were separated into two populations according to relative fluorescence intensity measured with SOM software. Small low-intensity endosome clusters (green) and large high-intensity endosome clusters (red) are differentiated in this colored image. Small endosome clusters were present in both control (a) and JAS-treated cells (b), whereas large endosome clusters were clearly more abundant in JAS-treated cells (b). (c) Quantification of relative fluorescence intensities showed that JAS treatment induced an approximately sixfold increase in uptake into the basal region and a significant increase in uptake into the middle region. In control cells, large endosome clusters were present mostly in the middle region, whereas in JAS-treated cells, the number of both types of clusters is significantly increased at the basal and middle regions.
Figure 7
Figure 7
FITC-transferrin uptake. FITC-transferrin was bound to the basolateral surface of control (a) and JAS-pretreated (b) MDCK cells at 4°C and then internalized for 15 min at 37°C. Small punctate FITC-transferrin-labeled compartments were present at similar levels in the basolateral cell periphery of both control (a) and JAS-pretreated (b) cells. Bar, 10 μm.
Figure 8
Figure 8
HRP uptake and accumulation. Control and JAS-treated cells were incubated with HRP added to the apical (A) or basolateral (B) chamber over a time course (0, 5, 15, 30, 60, and 120 min) for continuous labeling or added to the basolateral chamber in a pulse–chase regime for 10 min followed by chase incubations of 20, 50, and 110 min (C). HRP uptake values were determined by measuring the HRP activity present in the cell lysate of each filter-grown monolayer and were normalized to the protein concentration of each sample. JAS pretreatment increased the uptake of HRP from the basolateral cell surface at all time points (B) compared with uptake in control cells but had no effect on the apical uptake of HRP (A). Pulse–chase labeling (C) shows an initial increased uptake in JAS-treated cells, followed by a loss of HRP (recycling) during the first 60 min and then sustained accumulation at a higher level than control cells. Points in A and B represent the average of two values (i.e., two filters). In graph C, each data point is the mean and SEM of four samples.
Figure 9
Figure 9
Comparison of HRP uptake in control and JAS-treated cells by electron microscopy. The area of HRP-labeled structures was quantitated by point counting in defined areas on micrographs of the supranuclear region of the cells. Analysis showed that the relative density of HRP-labeled compartments in JAS-pretreated cells was more than twofold that of control cells (A). There was no significant difference in the size of individual HRP-labeled compartments between control and JAS-pretreated cells (B).
Figure 10
Figure 10
HRP labeling and morphology of polarized MDCK cells. The ultrastructure of control (A) and JAS-treated (B and C) MDCK cells was examined after 15 min of HRP uptake from the basolateral side. All cells appeared as polarized monolayers with internalized HRP in a variety of compartments throughout endocytic pathways. Labeled structures were concentrated in the supranuclear or middle cell regions and were particularly prominent in JAS-treated cells, where they can be seen as clusters of tubular or multivesicular endocytic compartments containing HRP (arrows; B and C). In B, the apical microvillar surfaces of JAS-treated cells can be seen gathered up into prominent bunches (C), which were not present in control cells. Bar, 1 μm.
Figure 11
Figure 11
Effects of JAS and nocodazole on FITC-dextran uptake. FITC-dextran uptake was compared in JAS- and nocodazole-treated MDCK cells incubated with FITC-dextran in the basolateral chamber for 15 min. In JAS-treated cells, large characteristic labeled structures were present at the middle (a) and basal (c) region of the monolayer. In nocodazole treated cells, FITC-dextran-labeled compartments were present at the basolateral cell periphery (d). In contrast to JAS-treated cells, there were less labeled compartments in the supranuclear region of nocodazole-treated cells (b), the labeled endocytic vesicles being smaller and more uniform in size (b and d). Bar, 10 μm.
Figure 12
Figure 12
Double labeling of endocytic compartments. JAS-pretreated cells were incubated with FITC-dextran added to the basolateral chamber for 15 or 30 min at 37°C and then stained with primary antibodies followed by Cy3-conjugated antibodies. An antibody against rab5, a marker for early endocytic compartments, did not colocalize with any of the vesicles labeled with FITC-dextran after 15 min uptake (a and b). rab7 (c and d) and M6PR (e and f), markers for late endosomes, showed no colocalization with FITC-dextran after 30 min uptake. TRITC-transferrin showed partial colocalization with labeled compartments in the basal region of the cells but not in the middle region after uptake for 15 min (g and h). Green, FITC-dextran; red, specific antibody or TRITC-transferrin; M, middle region; B, basal region. Bar, 10 μm.

Similar articles

Cited by

References

    1. Bomsel M, Parton R, Kuznetsov SA, Shroer TA, Gruenberg J. Microtubule- and motor-dependent fusion in vitro between apical and basolateral endocytic vesicles from MDCK cells. Cell. 1990;62:739–731. - PubMed
    1. Bomsel M, Prydz K, Parton RG, Gruenberg J, Simons K. Endocytosis in filter-grown Madin–Darby canine kidney cells. J Cell Biol. 1989;109:3243–3258. - PMC - PubMed
    1. Brown D, Sabolic I. Endosomal pathways for water channel and proton pump recycling in kidney epithelial cells. J Cell Sci Suppl. 1993;17:49–59. - PubMed
    1. Brown D, Stow JL. Protein trafficking and polarity in kidney epithelium: from cell biology to physiology. Physiol Rev. 1996;76:245–297. - PubMed
    1. Bubb MR, Senderowicz AMJ, Sausville EA, Duncan KLK, Korn ED. Jasplakinolide, a cytotoxic natural product, induces actin polymerization and competively inhibits the binding of phalloidin to F-actin. J Biol Chem. 1994;269:14869–14871. - PubMed

Publication types

MeSH terms

LinkOut - more resources