. 1998 Apr 1;12(7):982-95.
doi: 10.1101/gad.12.7.982.

CHOP is implicated in programmed cell death in response to impaired function of the endoplasmic reticulum

Affiliations

CHOP is implicated in programmed cell death in response to impaired function of the endoplasmic reticulum

H Zinszner et al. Genes Dev. .

Abstract

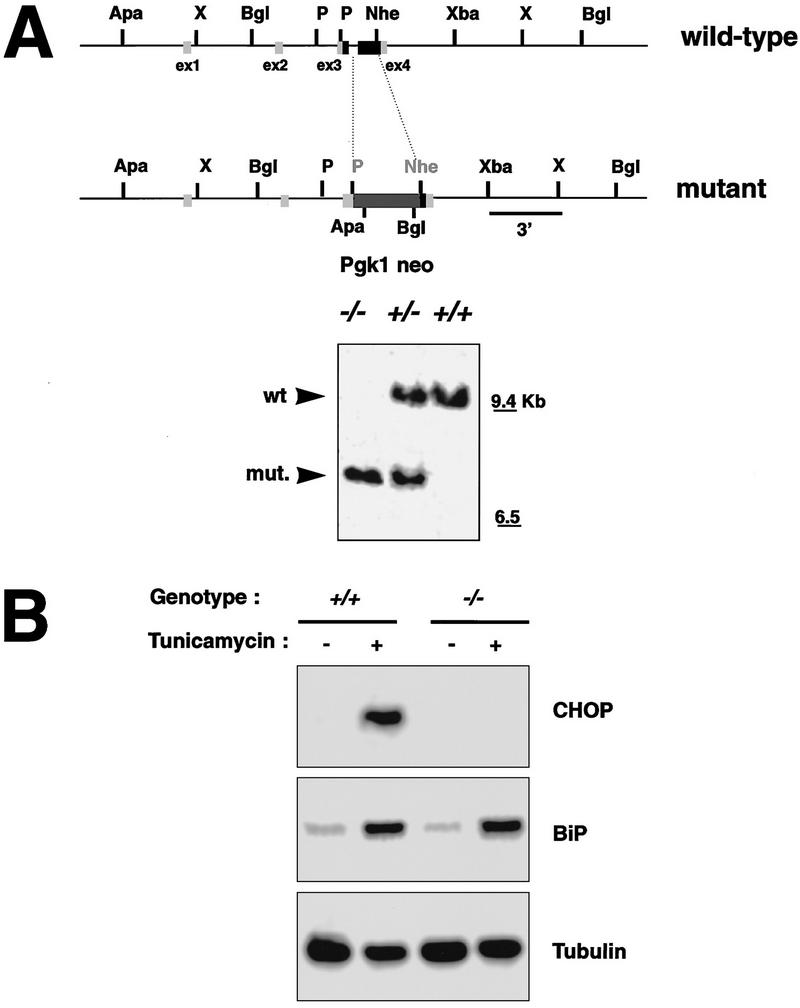
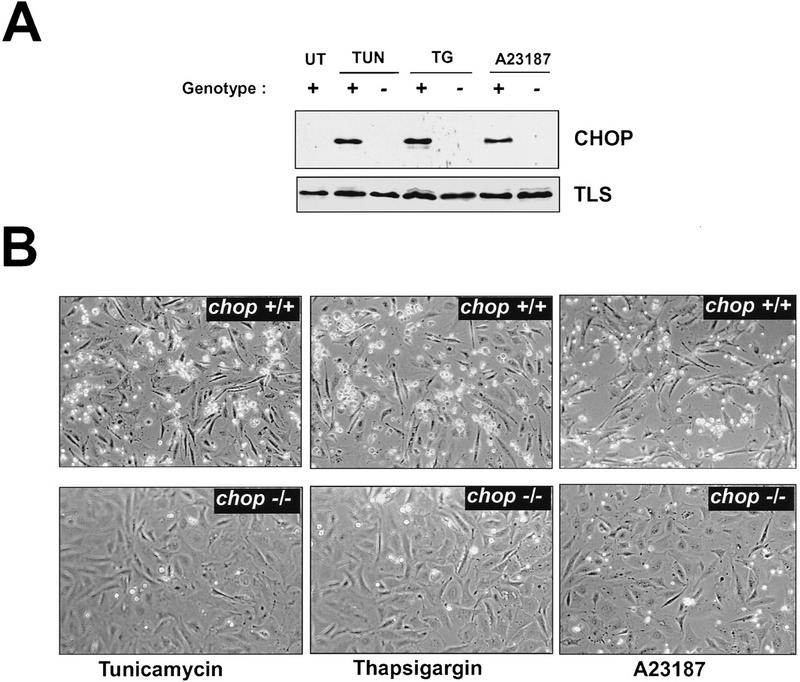
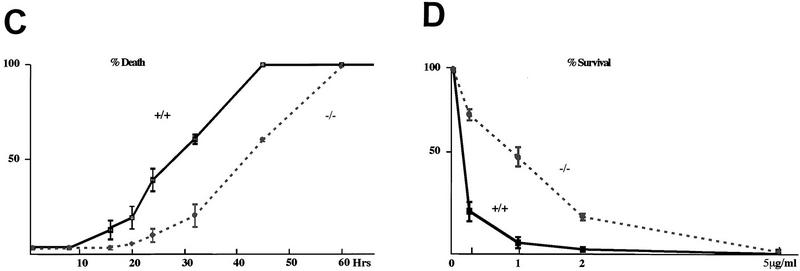
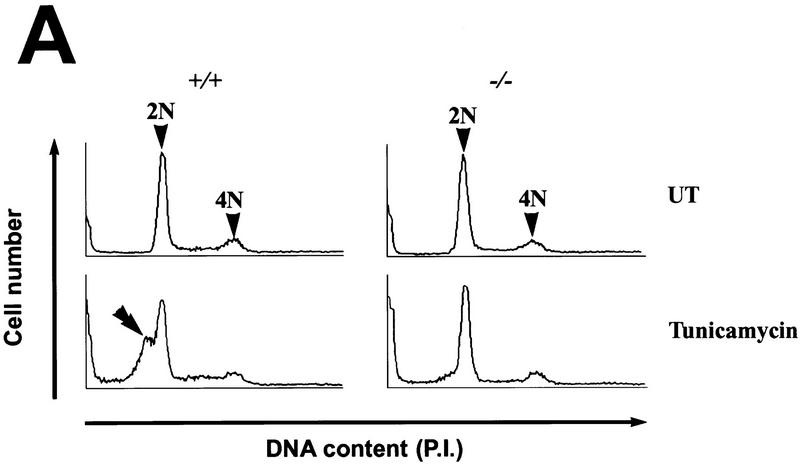
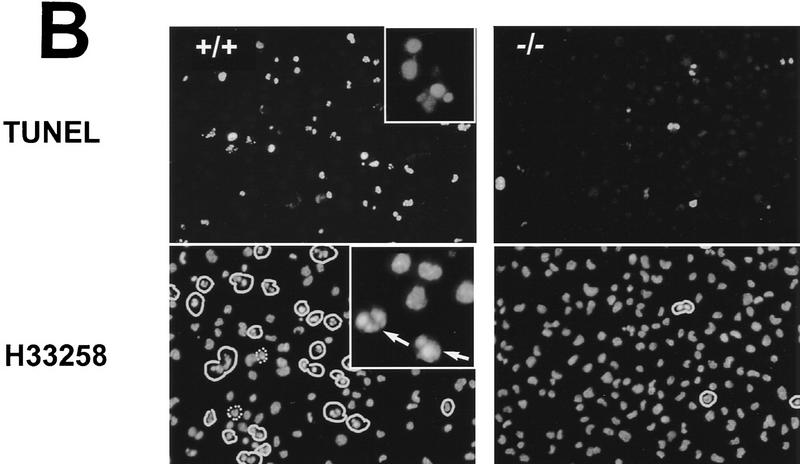
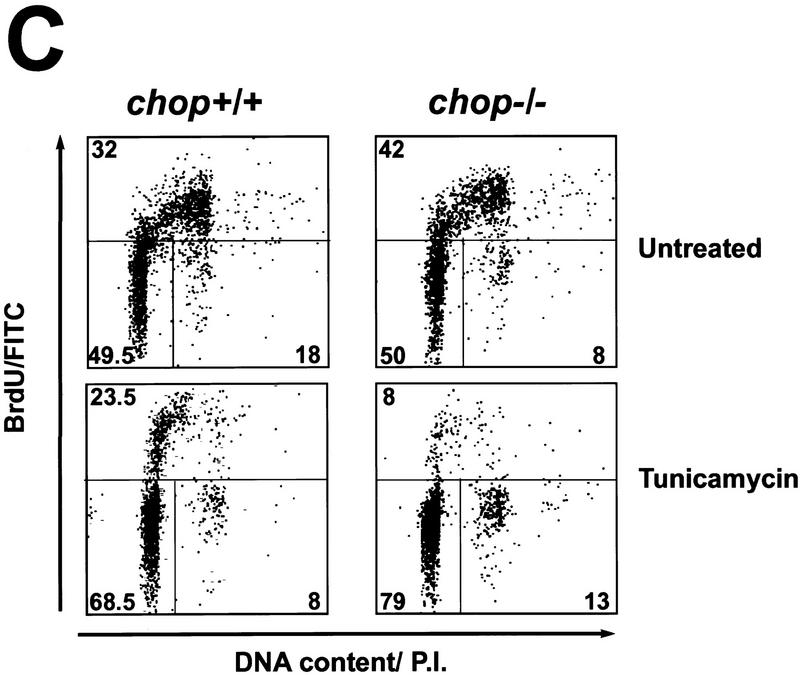
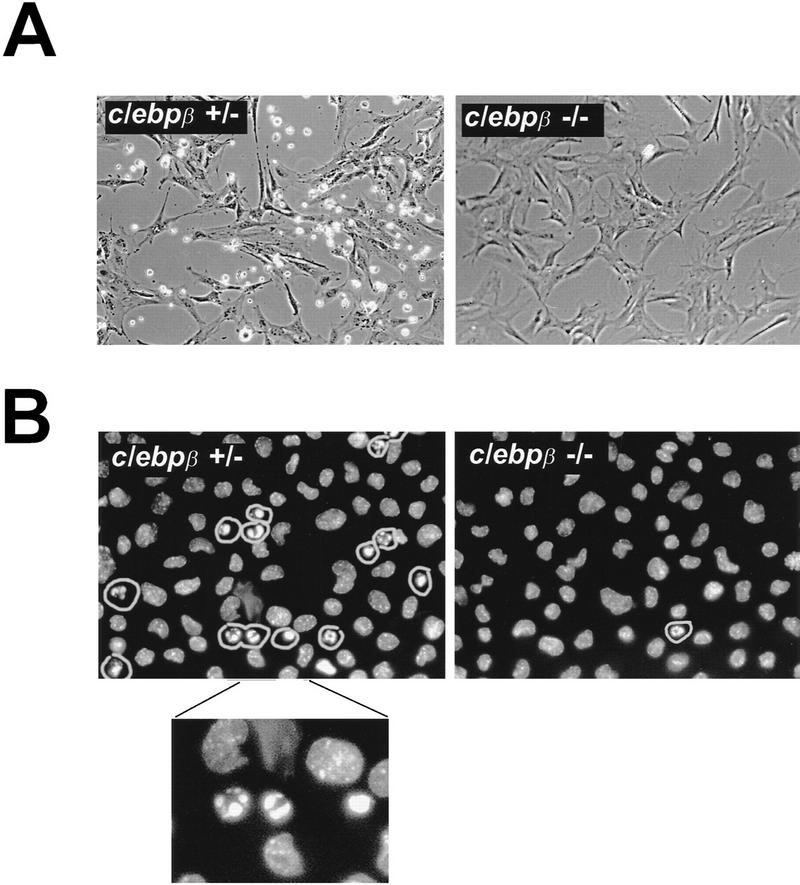
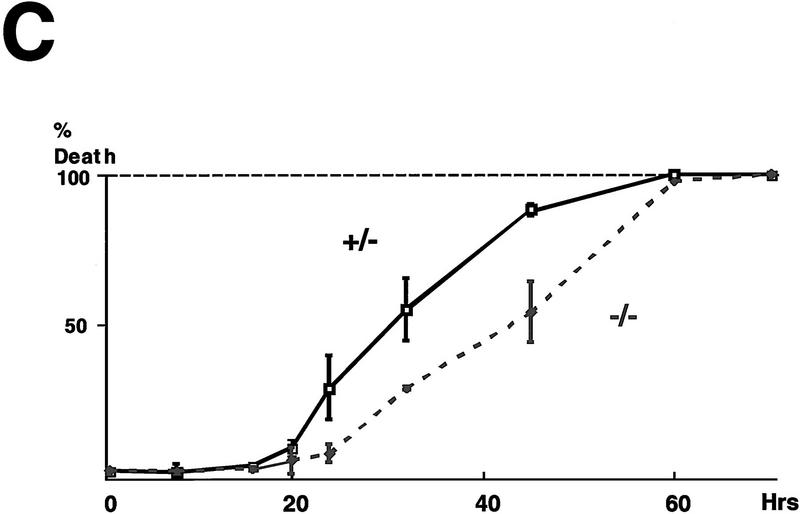
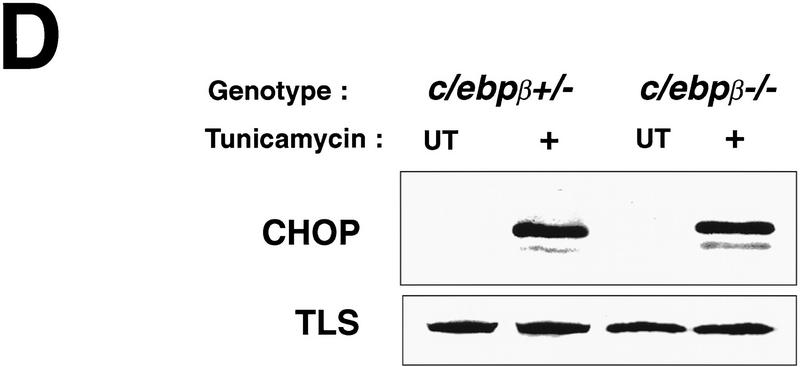
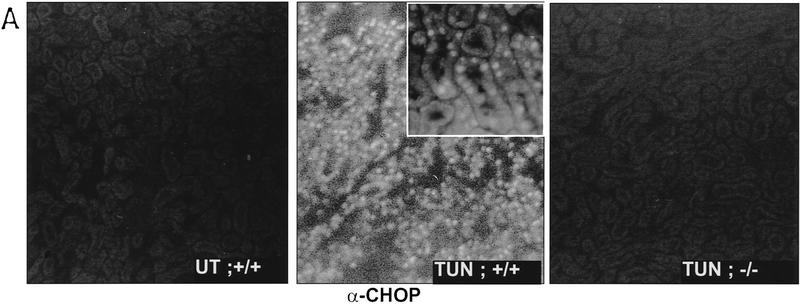
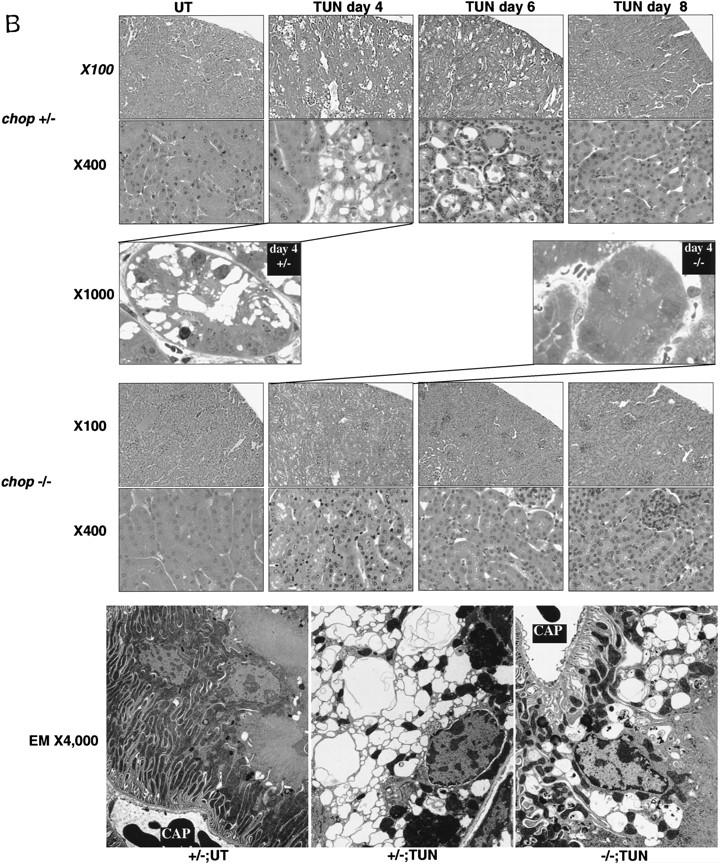
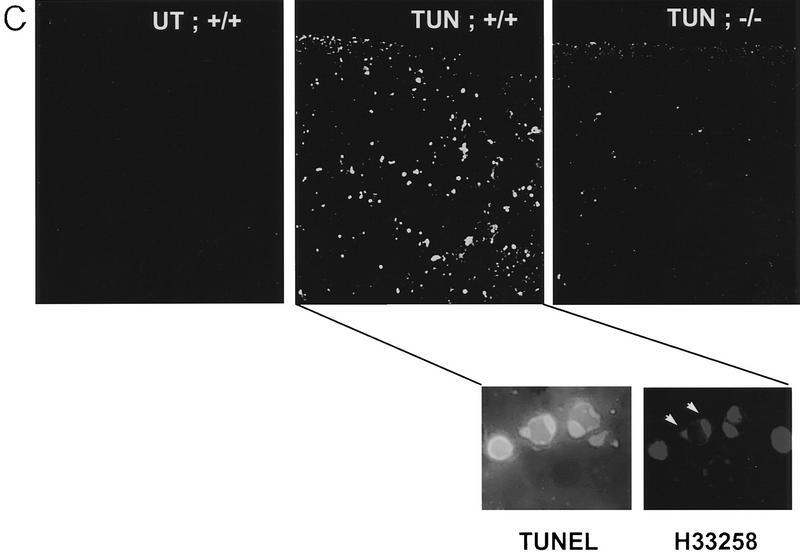
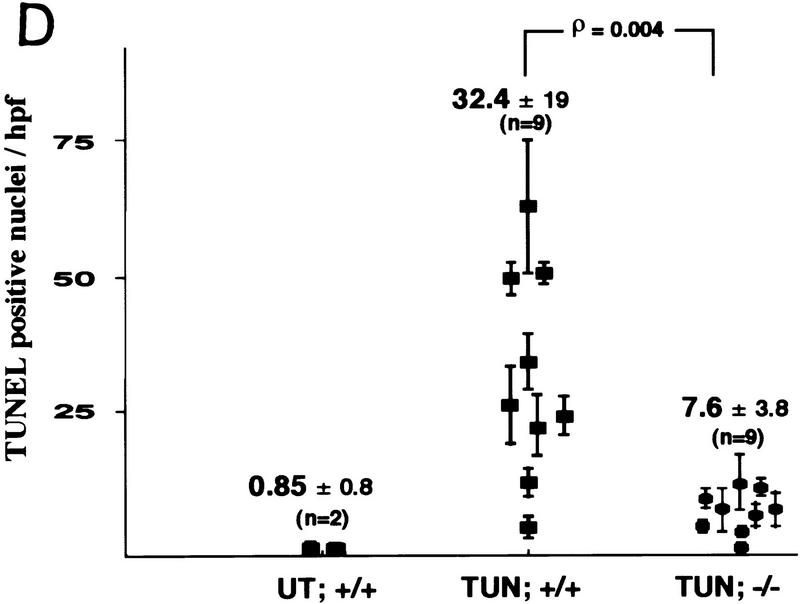
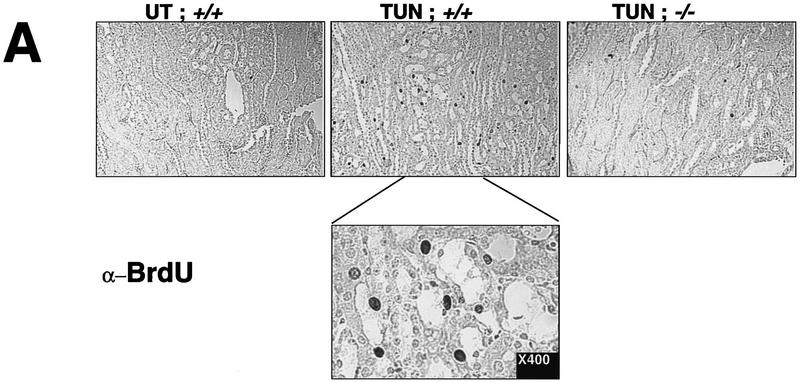
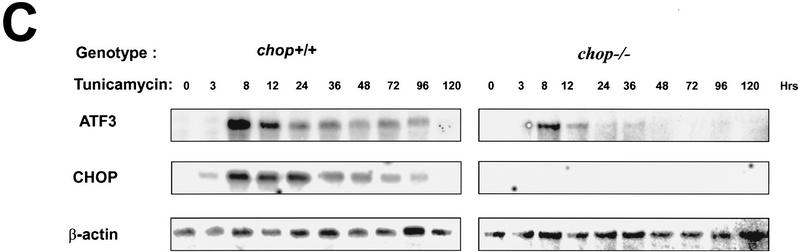
Cellular stress, particularly in response to toxic and metabolic insults that perturb function of the endoplasmic reticulum (ER stress), is a powerful inducer of the transcription factor CHOP. The role of CHOP in the response of cells to injury associated with ER stress was examined in a murine deficiency model obtained by homologous recombination at the chop gene. Compared with the wild type, mouse embryonic fibroblasts (MEFs) derived from chop -/- animals exhibited significantly less programmed cell death when challenged with agents that perturb ER function. A similar deficit in programmed cells death in response to ER stress was also observed in MEFs that lack CHOP's major dimerization partner, C/EBPbeta, implicating the CHOP-C/EBP pathway in programmed cell death. An animal model for studying the effects of chop on the response to ER stress was developed. It entailed exposing mice with defined chop genotypes to a single sublethal intraperitoneal injection of tunicamycin and resulted in a severe illness characterized by transient renal insufficiency. In chop +/+ and chop +/- mice this was associated with the early expression of CHOP in the proximal tubules followed by the development of a histological picture similar to the human condition known as acute tubular necrosis, a process that resolved by cellular regeneration. In the chop -/- animals, in spite of the severe impairment in renal function, evidence of cellular death in the kidney was reduced compared with the wild type. The proximal tubule epithelium of chop -/- animals exhibited fourfold lower levels of TUNEL-positive cells (a marker for programmed cell death), and significantly less evidence for subsequent regeneration. CHOP therefore has a role in the induction of cell death under conditions associated with malfunction of the ER and may also have a role in cellular regeneration under such circumstances.


Figures

Figure 1
Figure 1
Deletion of the chop gene. (A) Structure of wild-type and mutant chop alleles. Exons are boxed, the coding region is shaded. In the targeted allele the chop-coding region, between the PmlI and the NheI sites is replaced by a PGK.neo gene (Apa–ApaI, X-XhoI, Bgl–BglII, P–PmlI, Nhe–NheI, Xba–XbaI). (Inset) An autoradiograph of a Southern blot of BglII-digested genomic DNA hybridized with a 3′ probe that is external to the targeting construct and detects both the wild-type and mutant chop alleles. (B) Northern blot analysis of CHOP, BiP, and tubulin in tunicamycin-treated (1 μg/ml for 6 hr) MEFs with the indicated chop genotypes. Note the absence of CHOP mRNA and the normal BiP induction in the chop −/− cells.
Figure 2
Figure 2
chop-deficient cells have enhanced survival when challenged with toxins that induce ER stress. (A) Western blots of CHOP and TLS (an internal control) proteins in lysates from MEFs with the indicated chop genotype following 6 hr of treatment with tunicamycin (TUN, 1 μg/ml), thapsigargin (TG, 2 μm), and calcium ionophore (A23187, 2 μm). (B) Phase-contrast photomicrograph of MEFs treated for 24 hr with the indicated compounds (320×). (C) Quantification of the fraction of dead cells as a function of time in tunicamycin treated MEFs with the indicated genotypes. (D) Survival of cells plated at low density and treated for 24 hr with the indicated dose of tunicamycin and then changed to normal growth media. At each dose, the number of colonies at 10 days in the treated plates is compared with the number of colonies in an untreated plate of the same density. Shown are mean and s.d. of a typical experiment performed in triplicate and repeated three times using independently prepared pools of MEFs.
Figure 2
Figure 2
chop-deficient cells have enhanced survival when challenged with toxins that induce ER stress. (A) Western blots of CHOP and TLS (an internal control) proteins in lysates from MEFs with the indicated chop genotype following 6 hr of treatment with tunicamycin (TUN, 1 μg/ml), thapsigargin (TG, 2 μm), and calcium ionophore (A23187, 2 μm). (B) Phase-contrast photomicrograph of MEFs treated for 24 hr with the indicated compounds (320×). (C) Quantification of the fraction of dead cells as a function of time in tunicamycin treated MEFs with the indicated genotypes. (D) Survival of cells plated at low density and treated for 24 hr with the indicated dose of tunicamycin and then changed to normal growth media. At each dose, the number of colonies at 10 days in the treated plates is compared with the number of colonies in an untreated plate of the same density. Shown are mean and s.d. of a typical experiment performed in triplicate and repeated three times using independently prepared pools of MEFs.
Figure 3
Figure 3
The enhanced survival of chop −/− MEFs is attributable to less programmed cell death when challenged with tunicamycin. (A) Analysis of DNA content by FACS of fixed, propidium iodide-stained MEFs with the indicated chop genotype that had been treated for 24 hr with tunicamycin (1 μg/ml). Note the presence of a population of cells with hypo-diploid DNA content typical of programmed cell death (double arrowhead). (B) (Top panel) Fluorescent photomicrographs (200×, 400×, inset) of MEFs with the indicated chop genotype after 24 hr of tunicamycin treatment (1 μg/ml) whose DNA was 3′-end labeled with fluorescent nucleotides (TUNEL assay). (Bottom panel) Cells stained with the DNA-binding dye H33258 to reveal the presence of cells with condensed chromatin (arrows). The fraction of TUNEL-positive cells after 24 hr of tunicamycin (1 μg/ml) was compared in four individual clones of chop +/+ MEFs and chop −/− MEFs (28.2% ± 4.8% and 6.75% ± 3.6 mean and s.d. respectively, ρ = 0.02, two-tailed t-test). (C) MEFs with either chop genotype undergo cell cycle arrest when exposed to tunicamycin. Shown is a dual-channel FACS analysis of MEFs released from serum starvation in the presence of tunicamycin (1 μg/ml) and 12 hr later pulsed with BrdU for 2 hr before harvest, fixed and stained with anti-BrdU to reveal the fraction of cells in S-phase and propidium iodide to estimate DNA content. Note that the fraction of cells in S-phase and M2 is lower in the treated than in the untreated cells with an even greater reduction in the chop −/− compared with the chop +/+ cells.
Figure 3
Figure 3
The enhanced survival of chop −/− MEFs is attributable to less programmed cell death when challenged with tunicamycin. (A) Analysis of DNA content by FACS of fixed, propidium iodide-stained MEFs with the indicated chop genotype that had been treated for 24 hr with tunicamycin (1 μg/ml). Note the presence of a population of cells with hypo-diploid DNA content typical of programmed cell death (double arrowhead). (B) (Top panel) Fluorescent photomicrographs (200×, 400×, inset) of MEFs with the indicated chop genotype after 24 hr of tunicamycin treatment (1 μg/ml) whose DNA was 3′-end labeled with fluorescent nucleotides (TUNEL assay). (Bottom panel) Cells stained with the DNA-binding dye H33258 to reveal the presence of cells with condensed chromatin (arrows). The fraction of TUNEL-positive cells after 24 hr of tunicamycin (1 μg/ml) was compared in four individual clones of chop +/+ MEFs and chop −/− MEFs (28.2% ± 4.8% and 6.75% ± 3.6 mean and s.d. respectively, ρ = 0.02, two-tailed t-test). (C) MEFs with either chop genotype undergo cell cycle arrest when exposed to tunicamycin. Shown is a dual-channel FACS analysis of MEFs released from serum starvation in the presence of tunicamycin (1 μg/ml) and 12 hr later pulsed with BrdU for 2 hr before harvest, fixed and stained with anti-BrdU to reveal the fraction of cells in S-phase and propidium iodide to estimate DNA content. Note that the fraction of cells in S-phase and M2 is lower in the treated than in the untreated cells with an even greater reduction in the chop −/− compared with the chop +/+ cells.
Figure 4
Figure 4
MEFs lacking CHOP’s major dimerization partner, C/EBPβ, are also resistant to the death-promoting effects of tunicamycin. (A) Photomicrograph (300×) of MEFs with the indicated c/ebpβ genotype 24 hr after treatment with tunicamycin (1 μg/ml). (B) Nuclear morphology of the same cells fixed and stained with the DNA-binding dye H33258. Note the increased fraction of cells with condensed chromatin in the c/ebpβ +/− population. (C) Quantification of the fraction of dead cells as a function of time in the two populations, analyzed as in Fig. 2C. (D) Intact CHOP response to tunicamycin in the c/ebpβ mutant cells. Shown is a Western blot of CHOP and TLS (the internal control) in untreated and tunicamycin-treated cells with the indicated genotypes.
Figure 4
Figure 4
MEFs lacking CHOP’s major dimerization partner, C/EBPβ, are also resistant to the death-promoting effects of tunicamycin. (A) Photomicrograph (300×) of MEFs with the indicated c/ebpβ genotype 24 hr after treatment with tunicamycin (1 μg/ml). (B) Nuclear morphology of the same cells fixed and stained with the DNA-binding dye H33258. Note the increased fraction of cells with condensed chromatin in the c/ebpβ +/− population. (C) Quantification of the fraction of dead cells as a function of time in the two populations, analyzed as in Fig. 2C. (D) Intact CHOP response to tunicamycin in the c/ebpβ mutant cells. Shown is a Western blot of CHOP and TLS (the internal control) in untreated and tunicamycin-treated cells with the indicated genotypes.
Figure 5
Figure 5
Attenuated tissue response to tunicamycin in chop −/− mice. (A) CHOP is induced in the proximal renal tubular epithelium in response to tunicamycin injection. Photomicrographs (100× and 400×, inset) of rabbit anti-CHOP immunofluorescence on frozen sections of kidneys from mice with the indicated genotypes 24 hr after tunicamycin injection (1 mg/kg, IP). Note the intense CHOP nuclear staining of the tubular cells (inset) in the cortical portions of the kidney of the treated chop +/+ sample. (B) Histological analysis of kidney sections from mice with indicated chop genotypes following tunicamycin injection (1 μg/kg). The hematoxylin and eosin stained samples are shown at magnifications of 100× and 400× and the ultrathin toludine-blue section is magnified 1000×. The electron micrographs (EM) are at a magnification of 4000×, “CAP” indicates a capillary. Note the presence of pyknotic nuclei and debris in the tubules of the +/− animals on days 4 and 6 and the absence of conspicuous light-microscopic changes in the −/− samples. At higher magnification (EM samples) dilated endosomes are visible in both genotypes. (C) TUNEL staining of day 4 kidney sections from untreated and treated mice of the indicated genotypes (100×). The insets (400×) are of identical fields stained for TUNEL and with the DNA-binding dye H33258 to reveal condensed chromatin (arrowheads). (D) The number of TUNEL-positive cells per high-powered field was quantified in two untreated wild-type (UT), nine tunicamycin-treated wild-type, and nine tunicamycin-treated −/− mice. Shown is the mean and s.d. of the number of TUNEL-positive cells per high-powered field in each sample. The means in each group were compared by a two-tailed t-test.
Figure 5
Figure 5
Attenuated tissue response to tunicamycin in chop −/− mice. (A) CHOP is induced in the proximal renal tubular epithelium in response to tunicamycin injection. Photomicrographs (100× and 400×, inset) of rabbit anti-CHOP immunofluorescence on frozen sections of kidneys from mice with the indicated genotypes 24 hr after tunicamycin injection (1 mg/kg, IP). Note the intense CHOP nuclear staining of the tubular cells (inset) in the cortical portions of the kidney of the treated chop +/+ sample. (B) Histological analysis of kidney sections from mice with indicated chop genotypes following tunicamycin injection (1 μg/kg). The hematoxylin and eosin stained samples are shown at magnifications of 100× and 400× and the ultrathin toludine-blue section is magnified 1000×. The electron micrographs (EM) are at a magnification of 4000×, “CAP” indicates a capillary. Note the presence of pyknotic nuclei and debris in the tubules of the +/− animals on days 4 and 6 and the absence of conspicuous light-microscopic changes in the −/− samples. At higher magnification (EM samples) dilated endosomes are visible in both genotypes. (C) TUNEL staining of day 4 kidney sections from untreated and treated mice of the indicated genotypes (100×). The insets (400×) are of identical fields stained for TUNEL and with the DNA-binding dye H33258 to reveal condensed chromatin (arrowheads). (D) The number of TUNEL-positive cells per high-powered field was quantified in two untreated wild-type (UT), nine tunicamycin-treated wild-type, and nine tunicamycin-treated −/− mice. Shown is the mean and s.d. of the number of TUNEL-positive cells per high-powered field in each sample. The means in each group were compared by a two-tailed t-test.
Figure 6
Figure 6
Regeneration is attenuated in the chop −/− mice. (A) In vivo BrdU labeling of proximal tubular epithelial cells 5 days after tunicamycin injection. The BrdU-positive nuclei stain darkly (top panels, 100×; bottom panel, 400×). (B) Vimentin staining of frozen kidney sections following tunicamycin treatment. Note the increase in the number of vimentin-positive cells that line the tubules of the treated chop +/− samples (arrowheads). The light asterisks indicate the position of glomeruli and the dark asterisks point to vascular structures, both of which normally contain vimentin-positive mesenchymal cells. (C) Analysis of LRF/ATF3 expression (a regeneration marker) in kidneys of animals with the indicated chop genotype following tunicamycin injection (1 mg/kg, IP). (D) Plot of the relative intensity of the LRF/ATF3 signal as a function of time in animals with either genotype. Note the lack of sustained expression of the marker in the chop −/− samples when compared with the chop +/+ samples. Shown is a typical experiment that was repeated three times with similar results.
Figure 6
Figure 6
Regeneration is attenuated in the chop −/− mice. (A) In vivo BrdU labeling of proximal tubular epithelial cells 5 days after tunicamycin injection. The BrdU-positive nuclei stain darkly (top panels, 100×; bottom panel, 400×). (B) Vimentin staining of frozen kidney sections following tunicamycin treatment. Note the increase in the number of vimentin-positive cells that line the tubules of the treated chop +/− samples (arrowheads). The light asterisks indicate the position of glomeruli and the dark asterisks point to vascular structures, both of which normally contain vimentin-positive mesenchymal cells. (C) Analysis of LRF/ATF3 expression (a regeneration marker) in kidneys of animals with the indicated chop genotype following tunicamycin injection (1 mg/kg, IP). (D) Plot of the relative intensity of the LRF/ATF3 signal as a function of time in animals with either genotype. Note the lack of sustained expression of the marker in the chop −/− samples when compared with the chop +/+ samples. Shown is a typical experiment that was repeated three times with similar results.

References

    1. Barone MV, Crozat AY, Tabaee A, Philipson L, Ron D. CHOP (GADD153) and its oncogenic variant, TLS-CHOP, differ in their ability to induce G1/S arrest. Genes & Dev. 1994;8:453–464. - PubMed
    1. Bartlett J, Luethy J, Carlson S, Sollott S, Holbrook N. Calcium ionophore A23187 induces expression of the growth arrest and DNA damage inducible CCAAT/enhancer-binding protein (C/EBP)-related gene, gadd153. J Biol Chem. 1992;267:20465–20470. - PubMed
    1. Bissonnette RP, Echeverri F, Mahboubi A, Green DR. Apoptotic cell death induced by c-myc is inhibited by bcl-2. Nature. 1992;359:552–554. - PubMed
    1. Brewer JW, Cleveland JL, Hendershot LM. A pathway distinct from the mammalian unfolded protein response regulates expression of endoplasmic reticulum chaperones in non-stressed cells. EMBO J. 1997;16:7207–7216. - PMC - PubMed
    1. Bruhat A, Jousse C, Wang X-Z, Ron D, Ferrara M, Fafournoux F. Amino acid limitation induces expression of chop, a CCAAT/enhancer binding protein related gene at both transcriptional and post-transcriptional levels. J Biol Chem. 1997;272:17588–17593. - PubMed

Publication types

MeSH terms