. 1998 Apr 6;141(1):85-99.
doi: 10.1083/jcb.141.1.85.

Dynamin-mediated internalization of caveolae

Affiliations

Dynamin-mediated internalization of caveolae

J R Henley et al. J Cell Biol. .

Abstract

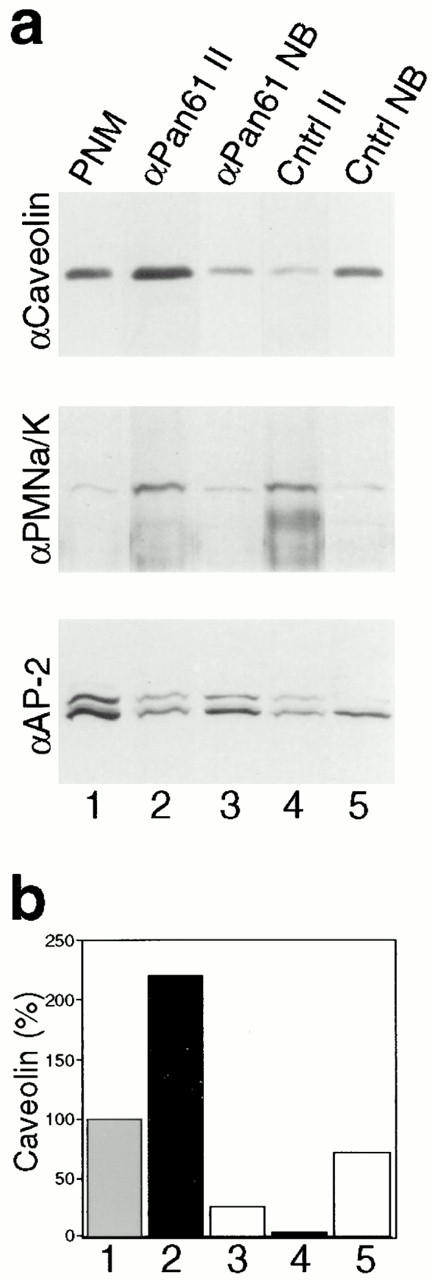
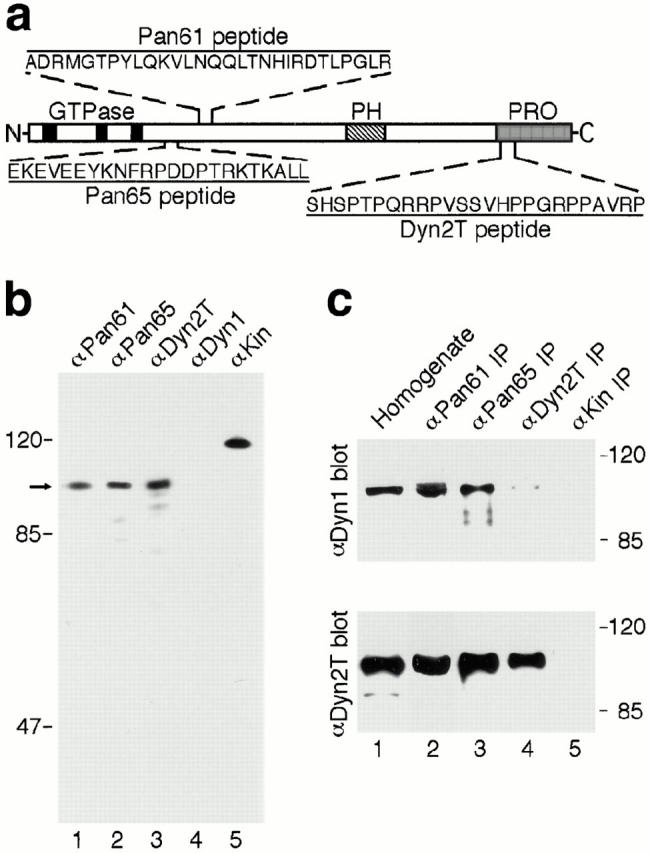
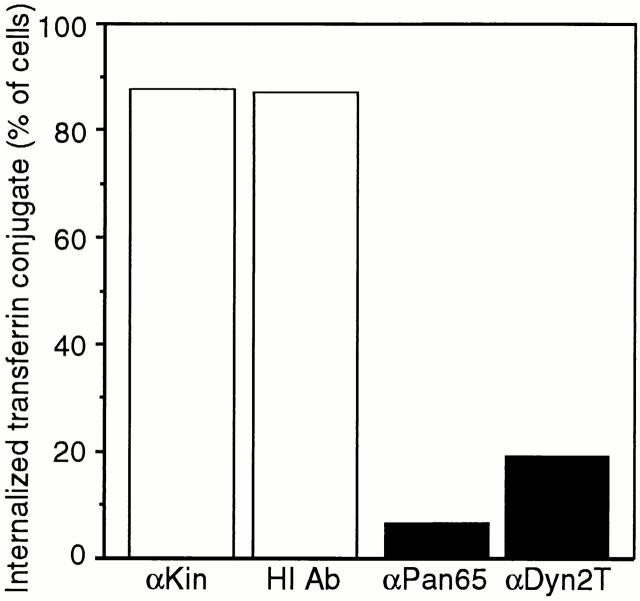
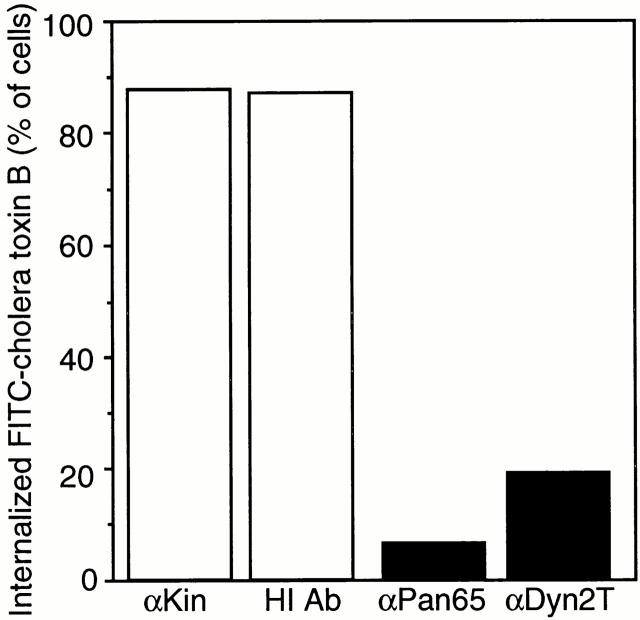
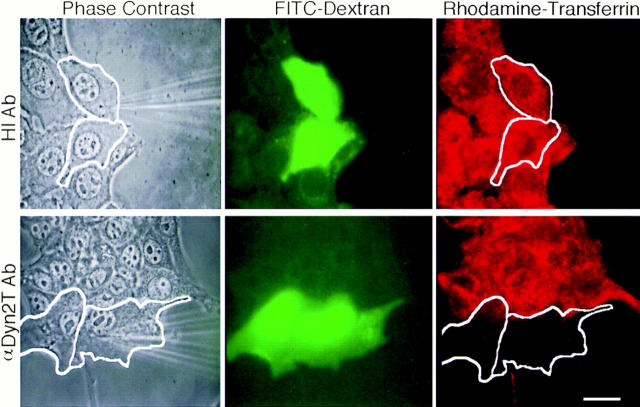
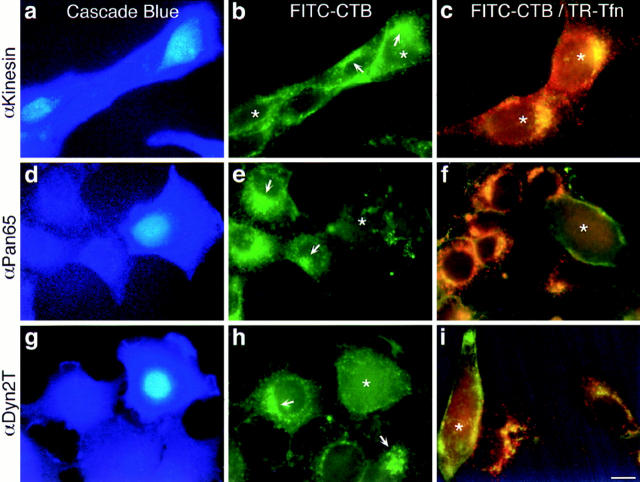
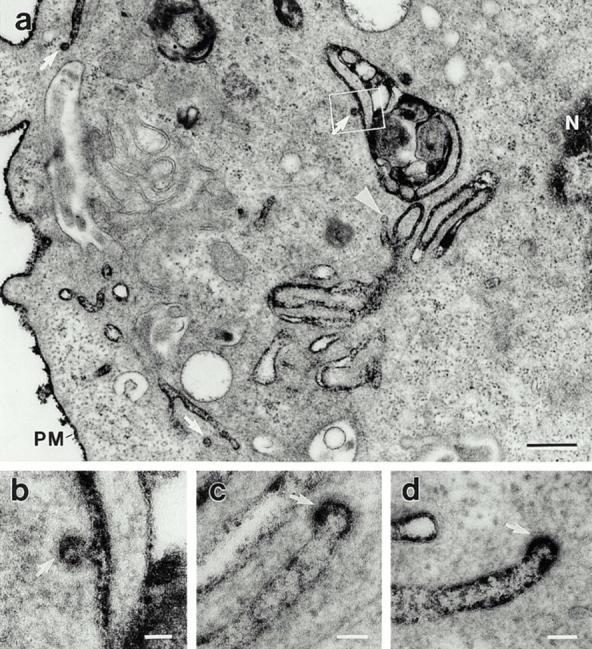
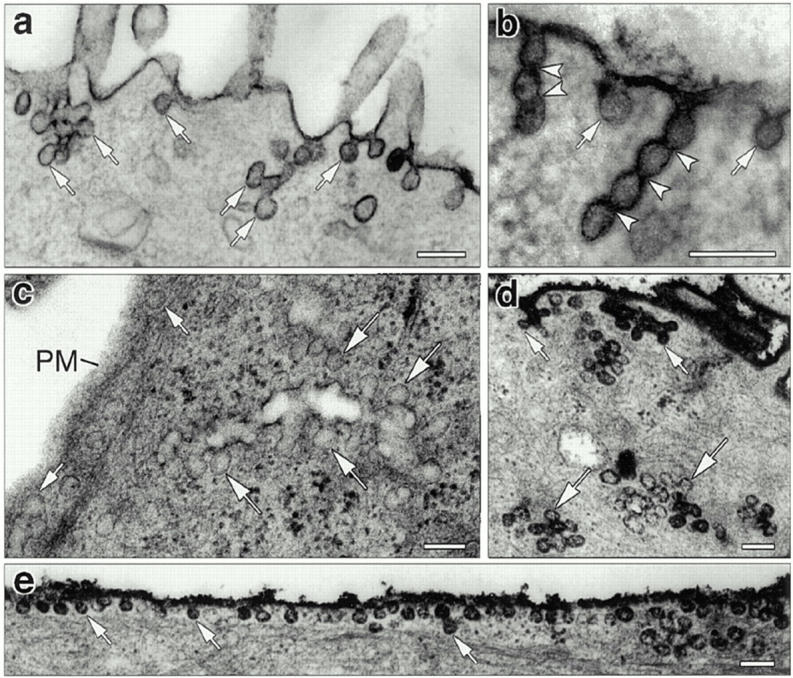
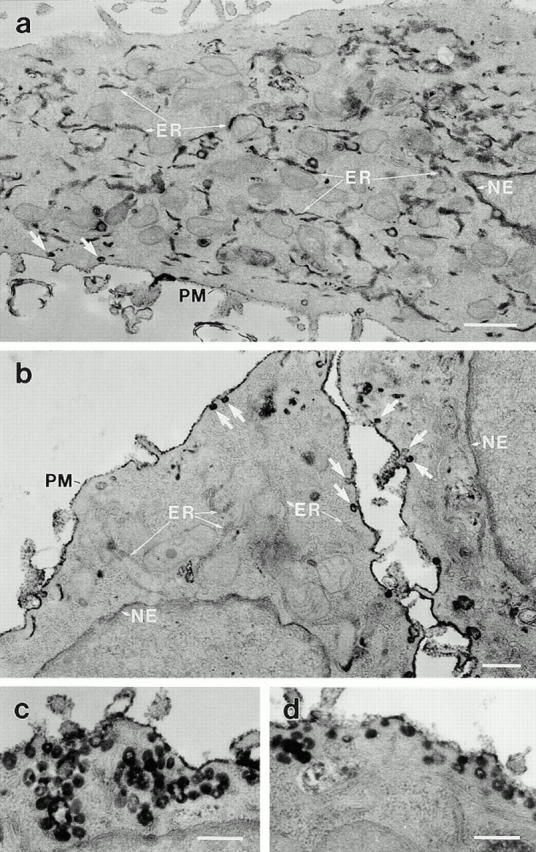
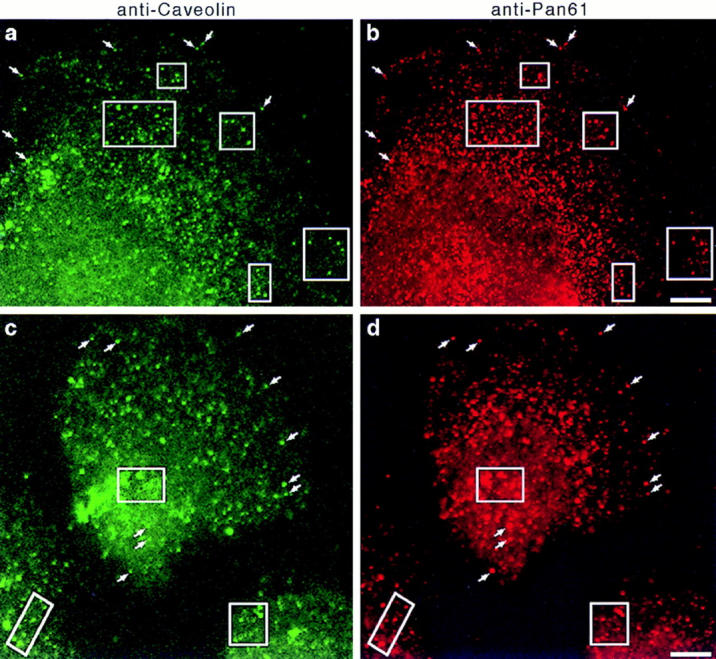
The dynamins comprise an expanding family of ubiquitously expressed 100-kD GTPases that have been implicated in severing clathrin-coated pits during receptor-mediated endocytosis. Currently, it is unclear whether the different dynamin isoforms perform redundant functions or participate in distinct endocytic processes. To define the function of dynamin II in mammalian epithelial cells, we have generated and characterized peptide-specific antibodies to domains that either are unique to this isoform or conserved within the dynamin family. When microinjected into cultured hepatocytes these affinity-purified antibodies inhibited clathrin-mediated endocytosis and induced the formation of long plasmalemmal invaginations with attached clathrin-coated pits. In addition, clusters of distinct, nonclathrin-coated, flask-shaped invaginations resembling caveolae accumulated at the plasma membrane of antibody-injected cells. In support of this, caveola-mediated endocytosis of labeled cholera toxin B was inhibited in antibody-injected hepatocytes. Using immunoisolation techniques an anti-dynamin antibody isolated caveolar membranes directly from a hepatocyte postnuclear membrane fraction. Finally, double label immunofluorescence microscopy revealed a striking colocalization between dynamin and the caveolar coat protein caveolin. Thus, functional in vivo studies as well as ultrastructural and biochemical analyses indicate that dynamin mediates both clathrin-dependent endocytosis and the internalization of caveolae in mammalian cells.


Figures

Figure 9
Figure 9
A dynamin antibody immunoisolates caveolar membranes. Representative immunoblots (a) and densitometric analysis (b) showing that caveolar membranes can be immunoisolated with an anti-dynamin antibody. (a) A starting postnuclear membrane fraction was prepared from cultured murine hepatocytes (lane 1), and fractions were immunoisolated with the anti-Pan61 (lane 2) and control anti–pIgA-R (lane 4) antibodies linked to paramagnetic beads. Immunoisolated fractions were collected with a magnet, whereas material that did not bind to the anti-Pan61 (lane 3) and control anti–pIgA-R (lane 5) antibodies was pelleted by centrifugation and collected as the nonbound fractions. Fractions then were subjected to SDS-PAGE and quantitative Western blot analysis using antibodies to the caveolar membrane coat protein caveolin (top); the Na+/K+ ATPase as a plasmalemmal marker (middle); and α-adaptin, a marker for AP-2/clathrin coats at the plasma membrane (bottom). Caveolin is enriched substantially in the immunoisolated fraction obtained with the anti-Pan61 antibody over that found in the fraction obtained with the control antibody, whereas the plasmalemmal Na+/K+ ATPase and the AP-2 adaptor complex are not. Similar results were found from experiments done on cultured human fibroblast membrane fractions (data not shown). (b) Quantitation of the caveolin immunoreactivity that was detected in each of the fractions described above. Western blots were subjected to densitometric analysis and the relative intensity of the caveolin band in each fraction was normalized to the starting membrane fraction, which was set at 100%. Quantitation was done on blots from at least two experiments, with similar results (not shown).
Figure 1
Figure 1
Characterization of dynamin-specific antibodies. (a) Diagram depicting the portions of dynamin to which anti-peptide antibodies were made. Two regions (Pan61 and Pan65) are located within the NH2-terminal “head” domain near the last of three GTP-binding elements (black boxes) and are conserved among the different dynamin isoforms. A third region (Dyn2T) is located within the proline-rich COOH-terminal “tail” domain (PRO, shaded region) and is unique to Dyn2. The location of the pleckstrin homology domain is indicated (PH, striped box). (b) Antibodies to the Pan61, Pan65, and Dyn2T peptides react with dynamin specifically by Western blot analysis. A cytosolic fraction was prepared from rat liver and then subjected to SDS-PAGE and Western blot analysis using the anti-Pan61 (lane 1), anti-Pan65 (lane 2), and anti-Dyn2T (lane 3) antibodies, or polyclonal antibodies that are specific for Dyn1 (lane 4) and kinesin (lane 5) as controls. A prominent dynamin band at ∼100 kD (arrow) was detected with the anti-Pan61, anti-Pan65, and anti-Dyn2T antibodies but not with the anti-Dyn1 antibody, since Dyn1 is not expressed in epithelial tissues. The anti-kinesin antibody recognized a characteristic ∼120-kD band. The positions of molecular mass standards are on the left. (c) The anti-Pan61 and anti-Pan65 antibodies immunoprecipitate both Dyn1 and Dyn2 from rat brain, whereas the anti-Dyn2T antibody is specific for Dyn2. Dynamin was immunoprecipitated from a crude brain homogenate (lane 1) using affinity-purified anti-Pan61 (lane 2), anti-Pan65 (lane 3), and anti-Dyn2T (lane 4) antibodies. Control immunoprecipitates were obtained with the anti-kinesin antibody (lane 5). The starting brain homogenate and subsequent immune complexes were subjected to SDS-PAGE and Western blot analysis with either a Dyn1-specific antibody (top) or the anti-Dyn2T antibody (bottom). Both Dyn1 and Dyn2 precipitated with the anti-Pan61 and anti-Pan65 antibodies, whereas the anti-Dyn2T antibody precipitated Dyn2 specifically, with only trace amounts of Dyn1 detected.
Figure 3
Figure 3
Quantitated inhibition of clathrin-mediated endocytosis in anti-dynamin antibody-injected hepatocytes. The clathrin-mediated endocytosis of rhodamine- and Texas red–labeled transferrin is reduced greater than fourfold in cells injected with the anti-dynamin antibodies over that in control-injected cells. Hepatocytes were injected with the anti-kinesin (αKin; n = 78) and heat-inactivated (HI Ab; n = 271) antibodies as controls or the anti-Pan65 (αPan65; n = 135) and anti-Dyn2T (αDyn2T; n = 457) antibodies. Cells then were incubated with rhodamine- or Texas red–transferrin, fixed, and then processed for fluorescence microscopy as in Fig. 2. For each condition the number of injected cells that internalized the transferrin conjugate (those containing red fluorescence) was counted and expressed as a percentage of the sum of injected cells.
Figure 7
Figure 7
Quantitated inhibition of caveola-mediated endocytosis in anti-dynamin antibody-injected hepatocytes. Caveola-mediated endocytosis of FITC–cholera toxin B is reduced greater than fourfold in cells injected with the anti-dynamin antibodies over that in the control-injected cells. Hepatocytes were injected with anti-kinesin (αKin; n = 277) and heat-inactivated (HI Ab; n = 93) antibodies as controls or the anti-Pan65 (αPan65; n = 46) and anti-Dyn2T (αDyn2T; n = 184) antibodies. Cells then were labeled with FITC–cholera toxin B, fixed and processed for fluorescence microscopy as in Fig. 6. As described in Fig. 6, the criteria for counting a cell positive for internal FITC–cholera toxin B was the presence of perinuclear green fluorescence and a dark nucleus (or nuclear “ghost”). For each condition the number of injected cells that internalized the toxin conjugate was counted and expressed as a percentage of the total.
Figure 2
Figure 2
Microinjected anti-dynamin antibodies inhibit the internalization of rhodamine-transferrin in cultured hepatocytes. Fluorescence assay for clathrin-mediated endocytosis in living cells. Cultured hepatocytes were coinjected with FITC–dextran as a marker and either heat-inactivated (top) or native anti-Dyn2T antibodies (bottom). After a 2–4-h recovery period, the cells were incubated 15 min at 37°C in DME-BSA containing 5 μg/ml rhodamine-transferrin then rinsed and processed for fluorescence microscopy. The phase–contrast micrographs show an antibody-containing microneedle used to inject 2–3 cells in each field (outlined). The corresponding fluorescence micrographs show the green fluorescence of the dextran, indicating injected cells, and the red fluorescence of the internalized rhodamine-transferrin. The control- injected hepatocytes endocytosed the ligand as did the uninjected cells, whereas the anti-Dyn2T antibody-injected cells did not. Similar inhibition was found in the anti-Pan65 antibody-injected cells (not shown). Bar, 10 μm.
Figure 6
Figure 6
Microinjected anti-dynamin antibodies inhibit the internalization of FITC– cholera toxin B in living cells. Fluorescence micrographs of cultured hepatocytes injected with purified antibodies to kinesin (a–c) as a control, or the anti-Pan65 (d–f) and anti-Dyn2T (g–i) antibodies. Cascade blue hydrazide was included in the antibody solutions to identify injected cells (a, d, and g). Injected cells were incubated with FITC–cholera toxin B (FITC-CTB) at 4°C to allow binding, then rinsed and incubated in toxin-free medium for 2 h at 37°C to allow internalization. Cells were incubated an additional 30 min at 37°C in the absence (b, e, and h) or presence (c, f, and i) of Texas red–transferrin (TR-Tfn) then fixed for fluorescence microscopy as in Fig. 2. Asterisks mark injected cells. (a–c) In the control anti-kinesin antibody-injected cells and in the adjacent uninjected cells bright perinuclear green fluorescence (arrows) and noticeably dark nuclei indicate that caveola-mediated endocytosis of FITC–cholera toxin B has occurred. Likewise, the punctate red fluorescence in the double-labeled cells indicates that clathrin-mediated endocytosis of Texas red–transferrin was normal. In these cells the yellow fluorescence indicates a morphological overlap of the two ligands, most likely within endosomal compartments. (d–i) Cells that were injected with the anti-dynamin antibodies have little internal fluorescence when compared with the adjacent uninjected cells, indicating that the endocytic uptake of both FITC–cholera toxin B and Texas red–transferrin was inhibited. Bar, 10 μm.
Figure 4
Figure 4
Microinjected anti-dynamin antibodies induce the accumulation of long clathrin-coated pits. Electron micrographs showing the long plasmalemmal invaginations and associated coated pits (arrows) that form in anti-dynamin antibody-injected cells. Hepatocytes were injected with the anti-Dyn2T antibody as in Fig. 2 and then processed for electron microscopy with ruthenium red included in the fixatives to stain the surface membranes. (a) The densely stained structures, although deep within the cytoplasm near the nucleus (N), are continuous with the plasma membrane (PM). A nonclathrin-coated bud that is connected to a plasmalemmal invagination also can be seen (arrowhead). The outlined area is shown at higher magnification in b. (b–d) The bristle-like clathrin coat can readily be seen on the distended regions, or buds, of long plasmalemmal invaginations. Similar invaginations were found when the anti-Pan65 antibody was injected, but not in cells that were injected with the control solutions (not shown). Bars: (a) 0.3 μm; (b–d) 0.05 μm.
Figure 5
Figure 5
Accumulation of distinct endocytic structures in cultured hepatocytes injected with anti-dynamin antibodies. (a–c) Electron micrographs show typical membrane invaginations found at the surface of cells that were injected with the Dyn2-specific anti-Dyn2T antibody. Numerous budding profiles (small arrows) lacking clathrin coats and resembling caveolae were found at the plasma membrane (a and b). Long “chains” of vesicles separated by constrictions (arrowheads) also were found attached to the plasma membrane (b). In addition, clusters of multiple vesicular profiles were observed deeper within the cell (c, large arrows). Similar structures were found in the anti-Pan65 antibody-injected cells but not in the control-injected cells. (d and e) Electron micrographs of anti-Dyn2T (d) and anti-Pan65 (e) antibody-injected cells that were fixed and stained with ruthenium red as in Fig. 4. Dark vesicles reveal both surface (small arrows) and deep (large arrows) membrane invaginations that are continuous with the plasma membrane. Bars, 0.15 μm.
Figure 8
Figure 8
Anti-dynamin antibodies prevent the caveola-mediated endocytosis of HRP–cholera toxin B, as confirmed by electron microscopy. Electron micrographs show hepatocytes that were injected with either a heat-inactivated antibody as a control (a) or the anti-Pan65 antibody (b–d). After the injections, cells were incubated with HRP–cholera toxin B as in Fig. 6, fixed, then processed for diaminobenzidine cytochemistry and electron microscopy. (a) A control-injected cell showing the internal electron-dense peroxidase reaction product that is sequestered largely within elements of the rough endoplasmic reticulum (ER) and the nuclear envelope (NE), with little remaining at the plasma membrane (PM). (b–d) Cells injected with the native anti-Pan65 antibody have little, if any HRP–cholera toxin B labeling of the endosomes, the endoplasmic reticulum, and the nuclear envelope, with most of the peroxidase reaction product residing on the plasma membrane or in numerous caveolae (arrows) and grape-like caveolar clusters. Similar observations were made in cells injected with the anti-Dyn2T antibody (not shown). Bars: (a) 0.5 μm; (b–d) 0.2 μm.
Figure 10
Figure 10
Dynamin localizes to caveolae in cultured hepatocytes. Fluorescence micrographs representing laser scanning confocal microscopy of cultured hepatocytes that were double labeled with a monoclonal anti-caveolin antibody (a and c) as a marker for caveolae and the polyclonal anti-Pan61 antibody (b and d) to label the endogenous dynamin. Two separate fields of cells are shown (top and bottom). A significant number of vesicular structures are labeled with both antibodies (arrows and outlined areas), indicating a colocalization of dynamin and caveolin. A similar staining pattern was obtained with the anti-Pan65 antibody but not in controls where primary antibodies were omitted (not shown). Bars, 8.0 μm.

References

    1. Anderson RGW. Caveolae: where incoming and outgoing messengers meet. Proc Natl Acad Sci USA. 1993a;90:10909–10913. - PMC - PubMed
    1. Anderson RGW. Plasmalemmal caveolae and GPI-anchored membrane proteins. Curr Opin Cell Biol. 1993b;5:647–652. - PubMed
    1. Anderson RGW. Potocytosis of small molecules and ions by caveolae. Trends Cell Biol. 1993c;3:69–72. - PubMed
    1. Anderson RGW, Brown MS, Goldstein JL. Role of the coated endocytic vesicle in the uptake of receptor bound low density lipoprotein in human fibroblasts. Cell. 1977;10:351–364. - PubMed
    1. Anderson RGW, Kamen BA, Rothberg KG, Lacey SW. Potocytosis: sequestration and transport of small molecules by caveolae. Science. 1992;255:410–411. - PubMed

Publication types

MeSH terms