. 1998 Apr 6;141(1):163-74.
doi: 10.1083/jcb.141.1.163.

Pericentrin and gamma-tubulin form a protein complex and are organized into a novel lattice at the centrosome

Affiliations

Pericentrin and gamma-tubulin form a protein complex and are organized into a novel lattice at the centrosome

J B Dictenberg et al. J Cell Biol. .

Abstract

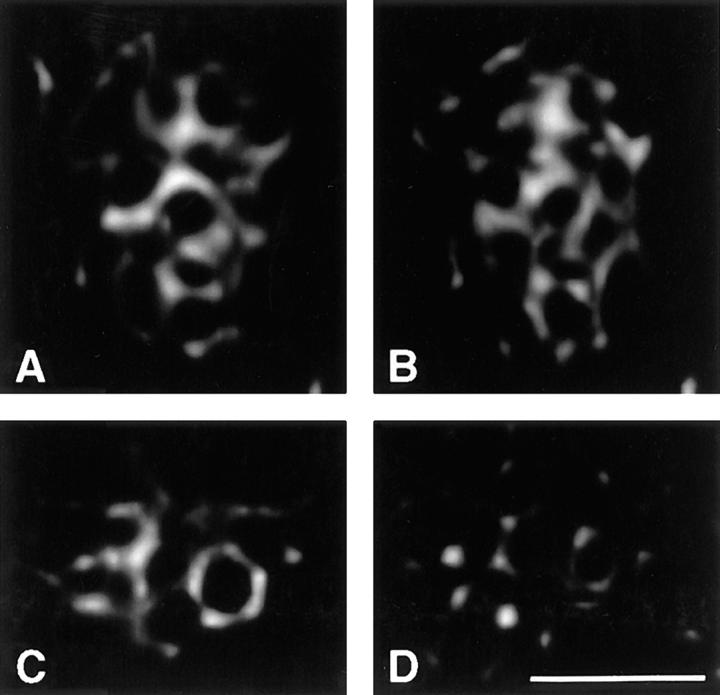
Pericentrin and gamma-tubulin are integral centrosome proteins that play a role in microtubule nucleation and organization. In this study, we examined the relationship between these proteins in the cytoplasm and at the centrosome. In extracts prepared from Xenopus eggs, the proteins were part of a large complex as demonstrated by sucrose gradient sedimentation, gel filtration and coimmunoprecipitation analysis. The pericentrin-gamma-tubulin complex was distinct from the previously described gamma-tubulin ring complex (gamma-TuRC) as purified gamma-TuRC fractions did not contain detectable pericentrin. When assembled at the centrosome, the two proteins remained in close proximity as shown by fluorescence resonance energy transfer. The three- dimensional organization of the centrosome-associated fraction of these proteins was determined using an improved immunofluorescence method. This analysis revealed a novel reticular lattice that was conserved from mammals to amphibians, and was organized independent of centrioles. The lattice changed dramatically during the cell cycle, enlarging from G1 until mitosis, then rapidly disassembling as cells exited mitosis. In cells colabeled to detect centrosomes and nucleated microtubules, lattice elements appeared to contact the minus ends of nucleated microtubules. Our results indicate that pericentrin and gamma-tubulin assemble into a unique centrosome lattice that represents the higher-order organization of microtubule nucleating sites at the centrosome.


Figures

Figure 3
Figure 3
Pericentrin coimmunoprecipitates with γ-tubulin but is not part of the isolated γ-TuRC. Various cellular fractions were exposed to SDS-PAGE and immunoblotted with pericentrin or γ-tubulin antibodies. (A) Centrosome fractions prepared from Xenopus tissue culture cells as described (Blomberg and Doxsey, 1998) and probed with pericentrin antibodies. Pericentrin (B) or γ-tubulin (C) immunoprecipitated from freshly prepared Xenopus extracts and blotted with pericentrin antibodies. γ-Tubulin (D) or pericentrin (E) immunoprecipitated from freshly prepared Xenopus extracts and blotted with γ-tubulin antibodies. Precipitations performed with pericentrin preimmune sera and blotted with pericentrin antibodies (F) or with no antibody (immunobeads alone) and blotted with γ-tubulin antibody (G). Purified γ-TuRC fractions immunoblotted with antibodies to γ-tubulin (H) or pericentrin (I).
Figure 4
Figure 4
Pericentrin forms a novel lattice at the centrosome. Microtubule aster and centrosome from a CHO cell stained with antibodies to α-tubulin (A) and pericentrin (B) and imaged by conventional immunofluorescence methods. (C) High magnification of unfixed CHO cell centrosome imaged as in (B). (D) Image of same centrosome shown in (C) using commercially-available deconvolution software (Scanalytics). (E and F) High resolution stereo images of same centrosome in (C) restored by the algorithm of Carrington (1995) (D, +6 degrees; E, −6 degrees). (G–K) Centrosome isolated from a CHO cell and labeled with antibodies to pericentrin to visualize lattice (G–I) and α-tubulin to visualize centrioles (J and K). Before restoration, pericentrin (G) and α-tubulin (K). After restoration, pericentrin staining showing entire three-dimensional data set (H) or five central planes (I) and α-tubulin staining showing three central planes (J). The two areas devoid of pericentrin staining (I) represent positions occupied by centrioles (J). (L–O) GFP–pericentrin expressed in COS cells (M) localized to the center of a microtubule aster detected by α-tubulin immunofluorescence staining (L). GFP-pericentrin before (N) and after (O) image restoration. Bars: (B) 10 μm for A and B; (C) 1 μm; (F) 1 μm for D–F; (K) 1 μm for G–K; (M) 10 μm for L and M; (O), 1 μm for N and O.
Figure 6
Figure 6
γ-Tubulin and pericentrin are part of the same lattice. (A and B) Restored images of two prophase centrosomes in CHO cells labeled by immunofluorescence for γ-tubulin (A) and pericentrin (B). (C and D) CHO cell centrosome stained for dynactin (C) and pericentrin (D). (E) Quantitative analysis of the coincidence of centrosome proteins in CHO cells using secondary antibodies tagged with different fluorophores (see Materials and Methods). Column 1, rat anti-pericentrin/rabbit anti-pericentrin; column 2, rabbit anti-pericentrin/mixed (fluorescein- and rhodamine-conjugated) anti–rabbit IgGs; column 3, rat anti-pericentrin/rabbit anti–γ-tubulin; column 4, rabbit anti-pericentrin/ mouse anti-centrin; and column 5, rat anti-pericentrin/rabbit anti-dynactin. Bar, 1 μm.
Figure 6
Figure 6
γ-Tubulin and pericentrin are part of the same lattice. (A and B) Restored images of two prophase centrosomes in CHO cells labeled by immunofluorescence for γ-tubulin (A) and pericentrin (B). (C and D) CHO cell centrosome stained for dynactin (C) and pericentrin (D). (E) Quantitative analysis of the coincidence of centrosome proteins in CHO cells using secondary antibodies tagged with different fluorophores (see Materials and Methods). Column 1, rat anti-pericentrin/rabbit anti-pericentrin; column 2, rabbit anti-pericentrin/mixed (fluorescein- and rhodamine-conjugated) anti–rabbit IgGs; column 3, rat anti-pericentrin/rabbit anti–γ-tubulin; column 4, rabbit anti-pericentrin/ mouse anti-centrin; and column 5, rat anti-pericentrin/rabbit anti-dynactin. Bar, 1 μm.
Figure 8
Figure 8
Dramatic cell cycle changes in the intracellular distribution of pericentrin and γ-tubulin and lattice structure. (A) Quantitative analysis of immunofluorescence signals from centrosome-associated pericentrin and γ-tubulin in CHO cells at various stages of the cell cycle (see Materials and Methods). Protein levels rise progressively from G1 until mitosis and then drop precipitously to basal levels. (B) Levels of pericentrin and γ-tubulin do not appear to change upon exit from mitosis. Lysates were prepared from metaphase cells (M) or from an equal number of metaphase cells induced to enter telophase (T; see Materials and Methods). Pericentrin was immunoprecipitated from lysates and immunoblotted with pericentrin antibodies as described in Fig. 3 (panel 1). Other lysates were used for immunoblotting with antibodies to γ-tubulin (Fig. 3 B, panel 2) or antibodies to cyclin B (Fig. 3 B, panel 3). Note that the cyclin B signal decreases from M to T, while the levels of pericentrin and γ-tubulin do not appear to change during this time. (C) Changes in lattice structure closely correlate with changes in the levels of centrosome-associated protein. The pericentrin lattice is simplest in G1 and enlarges to maximal size and complexity at G2, before separating to form a pair of centrosomes whose combined size at metaphase (M) is slightly larger than the G2 centrosome. When cells exit mitosis, the lattice rapidly returns to its simplest form (similar to that seen in G1). Similar results were observed with antibodies to γ-tubulin. Cell cycle stages: G1; S; G2; M, metaphase; A, anaphase; and T, telophase. Bar, 1 μm.
Figure 8
Figure 8
Dramatic cell cycle changes in the intracellular distribution of pericentrin and γ-tubulin and lattice structure. (A) Quantitative analysis of immunofluorescence signals from centrosome-associated pericentrin and γ-tubulin in CHO cells at various stages of the cell cycle (see Materials and Methods). Protein levels rise progressively from G1 until mitosis and then drop precipitously to basal levels. (B) Levels of pericentrin and γ-tubulin do not appear to change upon exit from mitosis. Lysates were prepared from metaphase cells (M) or from an equal number of metaphase cells induced to enter telophase (T; see Materials and Methods). Pericentrin was immunoprecipitated from lysates and immunoblotted with pericentrin antibodies as described in Fig. 3 (panel 1). Other lysates were used for immunoblotting with antibodies to γ-tubulin (Fig. 3 B, panel 2) or antibodies to cyclin B (Fig. 3 B, panel 3). Note that the cyclin B signal decreases from M to T, while the levels of pericentrin and γ-tubulin do not appear to change during this time. (C) Changes in lattice structure closely correlate with changes in the levels of centrosome-associated protein. The pericentrin lattice is simplest in G1 and enlarges to maximal size and complexity at G2, before separating to form a pair of centrosomes whose combined size at metaphase (M) is slightly larger than the G2 centrosome. When cells exit mitosis, the lattice rapidly returns to its simplest form (similar to that seen in G1). Similar results were observed with antibodies to γ-tubulin. Cell cycle stages: G1; S; G2; M, metaphase; A, anaphase; and T, telophase. Bar, 1 μm.
Figure 1
Figure 1
Pericentrin and γ-tubulin cosediment in sucrose gradients. (A) In vitro–translated, [35S]methionine-labeled mouse pericentrin was sedimented in sucrose gradients (10–40%) and exposed to SDS-PAGE as described in Materials and Methods. (A and B) Xenopus extracts were sedimented in sucrose gradients and immunoblotted using antibodies to pericentrin (B) or γ-tubulin (C). Parallel sample of the same extract immunodepleted of γ-tubulin (D and E) or treated with 0.1% Triton X-100 (F and G) before gradient centrifugation. Pericentrin immunoblots (B, D, and F); γ-tubulin immunoblots (C, E, and G). Molecular weight standards are for all panels.
Figure 2
Figure 2
Pericentrin and γ-tubulin cofractionate by gel filtration. Xenopus extracts were fractionated by gel filtration using a Superose-6 column. Proteins were precipitated from fractions with trichloroacetic acid, immunoblotted using antibodies to pericentrin or γ-tubulin, and then resulting bands were quantified (see Materials and Methods for details). Under optimal conditions, the majority of γ-tubulin and pericentrin eluted together in fractions 3–5, suggesting that they were part of a large complex (A and B, closed arrow). A variable portion of pericentrin eluted at fractions 5–7 and γ-tubulin at 9–11 (B, open arrows) when extracts were incubated for extended periods on ice (1 h). Y axes represent units of band intensity from Western blots.
Figure 5
Figure 5
The lattice is a conserved feature of centrosomes and other MTOCs. (A and B) Xenopus spindle assembled in vitro. (A) Spindle labeled for pericentrin (green), α-tubulin (red), and DNA (blue), imaged by conventional methods and superimposed. (B) Restored image of centrosome at upper pole of spindle in A. (C and D) Acentriolar mouse meiotic spindle arrested in metaphase II. (C) Spindle labeled for α-tubulin (green), pericentrin (red), and DNA (blue) prepared as in A. (D) Restored image of spindle pole at top of image in (C). Note difference in magnification between B and D. Bars: (A and C) 5 μm; (B and D) 1 μm.
Figure 7
Figure 7
The proximity of γ-tubulin and pericentrin at the centrosome is sufficient to produce FRET. Centrosomes colabeled for pericentrin (A, fluorescein) and γ-tubulin (B, rhodamine), or for pericentrin (C, fluorescein) and centrin (D, rhodamine) were illuminated to excite fluorescein. Images were captured using fluorescein and rhodamine emission filters and restored as in Fig. 4. The image resulting from the transfer of energy to rhodamine-labeled antibody bound to γ-tubulin (B) is very similar to that generated by the donor signal (A). In contrast, images generated when antibodies bound to centrin serve as acceptor (D) represent a small subset of the pericentrin image (C). The FRET ratio (E) is expressed as the proportion of fluorescence generated by the acceptor over that generated by the donor (which is quenched after efficient transfer). The FRET ratio of pericentrin and γ-tubulin (2) is similar to that obtained with two pericentrin antibodies (1) and much greater than that of pericentrin and centrin (3). Bar, 1 μm.
Figure 7
Figure 7
The proximity of γ-tubulin and pericentrin at the centrosome is sufficient to produce FRET. Centrosomes colabeled for pericentrin (A, fluorescein) and γ-tubulin (B, rhodamine), or for pericentrin (C, fluorescein) and centrin (D, rhodamine) were illuminated to excite fluorescein. Images were captured using fluorescein and rhodamine emission filters and restored as in Fig. 4. The image resulting from the transfer of energy to rhodamine-labeled antibody bound to γ-tubulin (B) is very similar to that generated by the donor signal (A). In contrast, images generated when antibodies bound to centrin serve as acceptor (D) represent a small subset of the pericentrin image (C). The FRET ratio (E) is expressed as the proportion of fluorescence generated by the acceptor over that generated by the donor (which is quenched after efficient transfer). The FRET ratio of pericentrin and γ-tubulin (2) is similar to that obtained with two pericentrin antibodies (1) and much greater than that of pericentrin and centrin (3). Bar, 1 μm.
Figure 9
Figure 9
Nucleated microtubules contact the lattice. Images of nucleated microtubules (red) and pericentrin (yellow) have been merged to show that the number of nucleated microtubules converging at the centrosome (many bundled in G2) and the size of the pericentrin lattice increase from S to G2 (also see Fig. 8, A and C). The inset in the first panel shows microtubule– lattice contacts in the simple early S phase centrosome. Inset shows the area of interaction (white) demonstrating near complete overlap of microtubule ends with lattice elements. See Materials and Methods. Similar results were obtained with γ-tubulin. Bars, 1 μm.
Figure 10
Figure 10
A model for centrosome assembly. The stoichiometry of pericentrin and γ-tubulin is consistent with a large complex consisting of one pericentrin complex and two γ-tubulin complexes. This model accommodates both of the current schemes proposed for microtubule nucleating complexes (Zheng et al., 1995; Erickson and Stoffler, 1996) (see Discussion). The complex appears to assemble at the centrosome to form a unique lattice (left). When dissociated, the complex gives rise to a pericentrin subcomplex, a γ-tubulin subcomplex and perhaps other proteins (right). Whereas the γ-tubulin subcomplex has not been characterized in this study, it has previously been shown that purified γ-TuRCs are capable of nucleating microtubules in vitro but are unable to assemble onto centrosomes (see Discussion). The pericentrin complex may facilitate assembly of γ-tubulin complexes into the centrosome lattice. Centrosome assembly and stabilization are likely to require other proteins.

References

    1. Adams SR, Harootunian AT, Buechler YJ, Taylor SS, Tsien RY. Fluorescence ratio imaging of cyclic AMP in single cells. Nature. 1991;349:694–697. - PubMed
    1. Albers K, Fuchs E. The molecular biology of intermediate filaments. Int Rev Cytol. 1992;134:243–279. - PubMed
    1. Archer J, Solomon F. Deconstructing the microtubule-organizing center. Cell. 1994;76:589–592. - PubMed
    1. Blomberg, M., and S.J. Doxsey. 1998. Rapid isolation of centrosomes. Methods Enzymol. In press. - PubMed
    1. Brown R, Doxsey SJ, Hong-Brown L, Martin RL, Welsh W. Molecular chaperones and the centrosome: a role for TCP-1 in microtubule nucleation. J Biol Chem. 1996;271:824–832. - PubMed

Publication types

MeSH terms