. 1998 Apr;116(4):1515-26.
doi: 10.1104/pp.116.4.1515.

Analysis of cell division and elongation underlying the developmental acceleration of root growth in Arabidopsis thaliana

Affiliations

Analysis of cell division and elongation underlying the developmental acceleration of root growth in Arabidopsis thaliana

G T Beemster et al. Plant Physiol. 1998 Apr.

Abstract

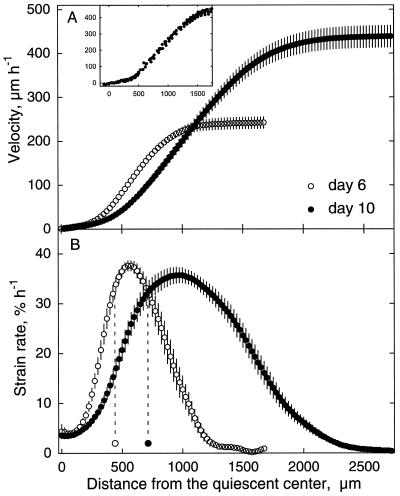
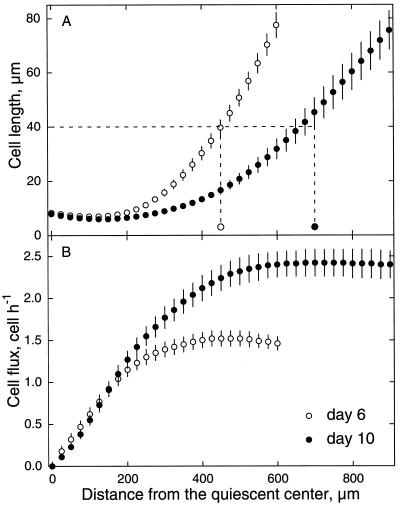
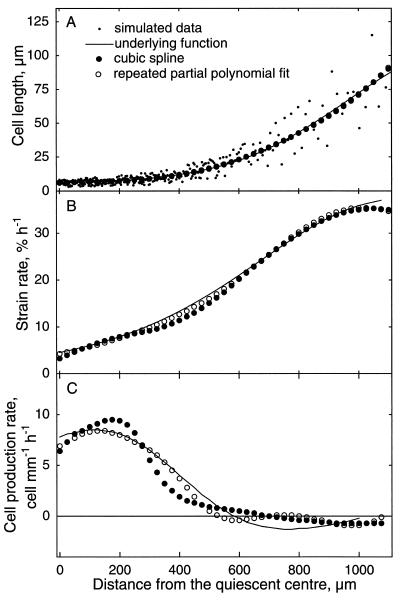
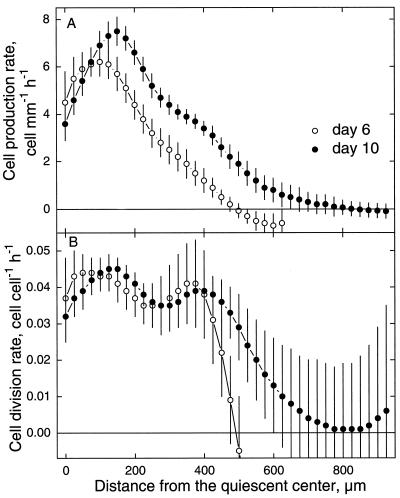
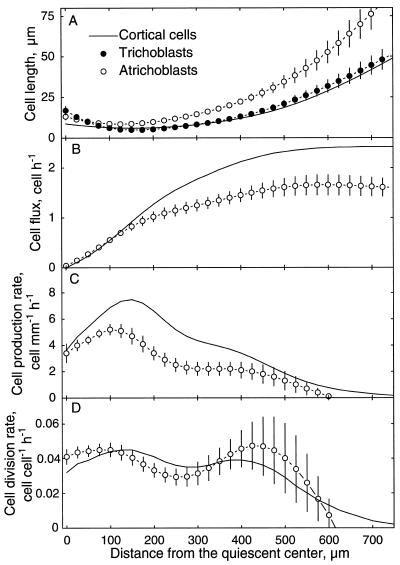
To investigate the relation between cell division and expansion in the regulation of organ growth rate, we used Arabidopsis thaliana primary roots grown vertically at 20 degreesC with an elongation rate that increased steadily during the first 14 d after germination. We measured spatial profiles of longitudinal velocity and cell length and calculated parameters of cell expansion and division, including rates of local cell production (cells mm-1 h-1) and cell division (cells cell-1 h-1). Data were obtained for the root cortex and also for the two types of epidermal cell, trichoblasts and atrichoblasts. Accelerating root elongation was caused by an increasingly longer growth zone, while maximal strain rates remained unchanged. The enlargement of the growth zone and, hence, the accelerating root elongation rate, were accompanied by a nearly proportionally increased cell production. This increased production was caused by increasingly numerous dividing cells, whereas their rates of division remained approximately constant. Additionally, the spatial profile of cell division rate was essentially constant. The meristem was longer than generally assumed, extending well into the region where cells elongated rapidly. In the two epidermal cell types, meristem length and cell division rate were both very similar to that of cortical cells, and differences in cell length between the two epidermal cell types originated at the apex of the meristem. These results highlight the importance of controlling the number of dividing cells, both to generate tissues with different cell lengths and to regulate the rate of organ enlargement.


Figures

Figure 2
Figure 2
Spatial profiles of longitudinal velocity and strain rate of A. thaliana roots on d 6 and 10. Data from each root were smoothed and interpolated as described in Methods; symbols are means ± se (when larger than the symbol) of 10 roots. A, Velocity; the inset shows raw data points for a single d 10 root. The final velocity on d 6 was 241 ± 6 μm h−1 and on d 10 it was 445 ± 12 μm h−1. B, Strain rate; symbols on the x axis and the vertical dashed lines mark the basal terminus of the meristem averaged from individual roots.
Figure 3
Figure 3
Spatial profiles of cell length and cell flux of cortical cells on d 6 and 10. Symbols are means ± se (when larger than the symbol) of 10 roots. A, Cell length; symbols on the x axis and vertical dashed lines indicate the average length of the meristem for individual roots, and the horizontal dashed line indicates the cell length at the end of the meristem averaged over all roots. Data from each root were smoothed and interpolated as described in Methods. B, Cell flux; the final cell flux was 1.68 ± 0.09 cells h−1 on d 6 and 2.55 ± 0.18 cells h−1 on d 10 (mean ± se).
Figure 1
Figure 1
Comparison of curve fitting with cubic (β) splines and repeated partial polynomials. A modified logistic function (Morris and Silk, 1992) was fitted to the velocity and cell length data of a d 10 plant, and random noise, with variance equal to that of the actual data, was added to generate simulated data sets. Each data set was smoothed and interpolated using cubic splines or repeated partial polynomials, and strain rates and cell division parameters were calculated as described in Methods. A, Cell length; B, strain rate; C, cell production rate. In B and C, the solid line plots the analytical solution of the function.
Figure 4
Figure 4
Spatial profiles of cell production rate and cell division rate in cortical cells on d 6 and 10. Cell production and division rates were calculated for each root as described in Methods; symbols are means ± se (when larger than the symbol) of 10 roots.
Figure 5
Figure 5
Spatial profiles of cell length and cell division parameters of epidermal cells. A, Cell length; because trichoblast cell length was similar to that of cortical cells, data for these cells are omitted from B to D for clarity. B, Cell flux; C, cell production rate; D, cell division rate. Data for cortical cells were re-drawn from Figures 3 and 4 and are shown for comparison. Data are for d 10. Symbols plot means ± se (when larger than the symbol) for five roots.

References

    1. Balodis VA, Ivanov VB. Proliferation of root cells in the basal part of meristem and apical part of elongation zone. Tsitologia. 1970;12:983–991. (in Russian)
    1. Balus̆ka F, Barlow PW, Kubica S̆. Importance of the post-mitotic isodiametric growth (PIG) region for growth and development of roots. Plant Soil. 1994;167:31–41.
    1. Balus̆ka F, Volkmann D, Barlow PW. Specialized zones of development in roots. View from the cellular level. Plant Physiol. 1996;112:3–4. - PMC - PubMed
    1. Barlow PW. Cell growth in the absence of division in a root meristem. Planta. 1969;88:215–223. - PubMed
    1. Barlow PW. Cellular packets, cell division and morphogenesis in the primary root meristem of Zea mays L. New Phytol. 1987;105:27–56. - PubMed

Publication types

MeSH terms

LinkOut - more resources