. 1998 Apr;116(4):1539-49.
doi: 10.1104/pp.116.4.1539.

Genes involved in osmoregulation during turgor-driven cell expansion of developing cotton fibers are differentially regulated

Affiliations

Genes involved in osmoregulation during turgor-driven cell expansion of developing cotton fibers are differentially regulated

L B Smart et al. Plant Physiol. 1998 Apr.

Abstract

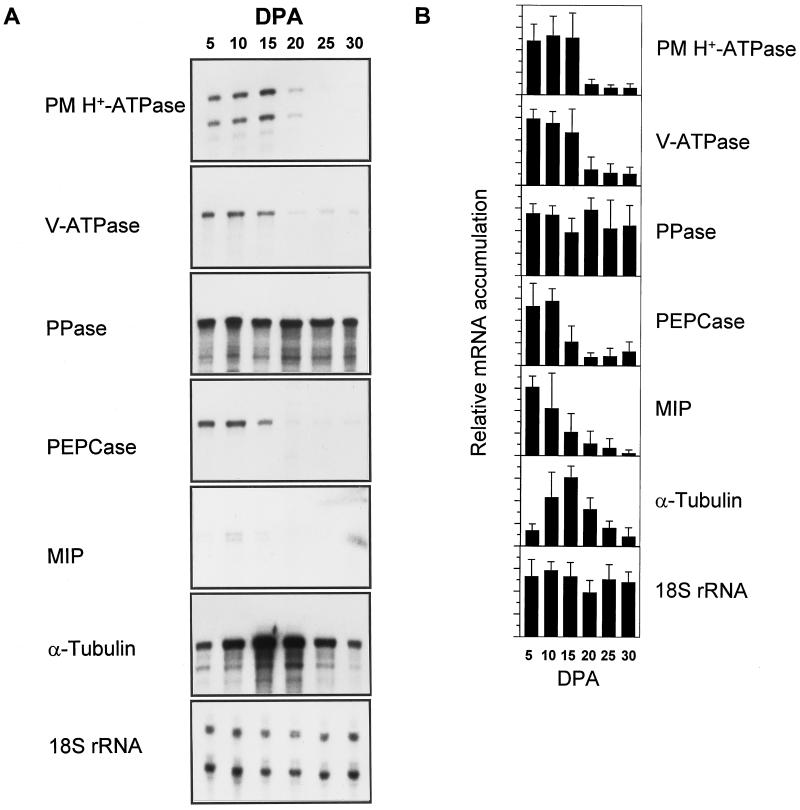
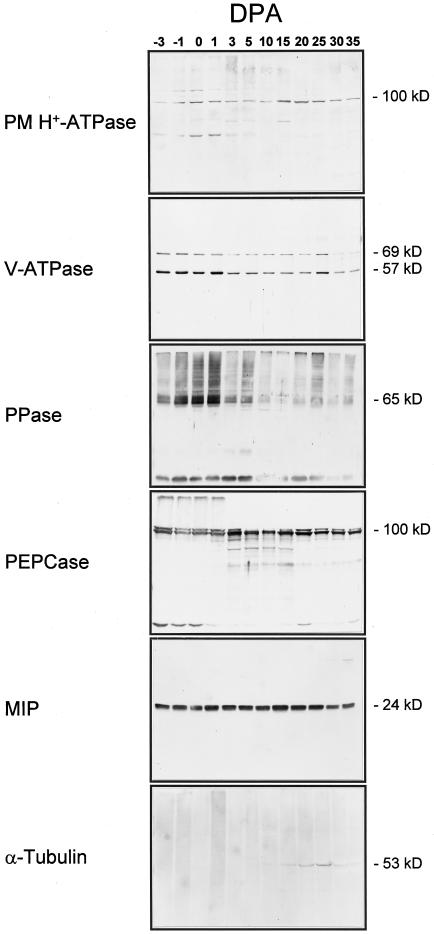
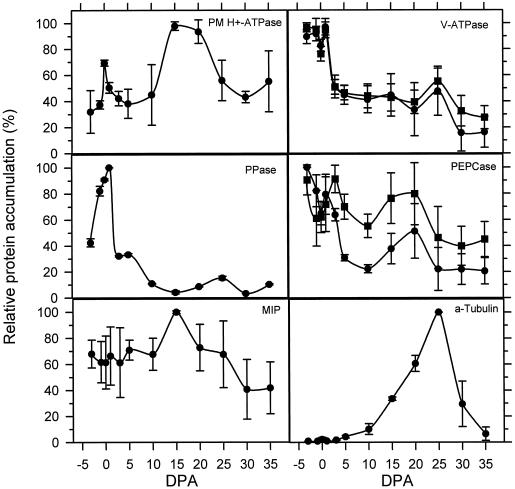
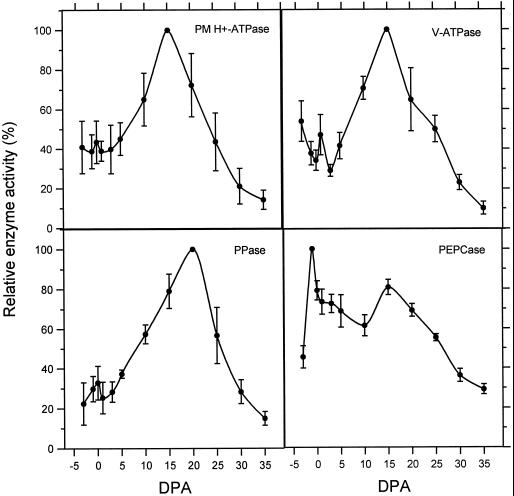
Cotton (Gossypium hirsutum L.) fibers are single-celled trichomes that synchronously undergo a phase of rapid cell expansion, then a phase including secondary cell wall deposition, and finally maturation. To determine if there is coordinated regulation of gene expression during fiber expansion, we analyzed the expression of components involved in turgor regulation and a cytoskeletal protein by measuring levels of mRNA and protein accumulation and enzyme activity. Fragments of the genes for the plasma membrane proton-translocating ATPase, vacuole-ATPase, proton-translocating pyrophosphatase (PPase), phosphoenolpyruvate carboxylase, major intrinsic protein, and alpha-tubulin were amplified by polymerase chain reaction and used as probes in ribonuclease protection assays of RNA from a fiber developmental series, revealing two discrete patterns of mRNA accumulation. Transcripts of all but the PPase accumulated to highest levels during the period of peak expansion (+12-15 d postanthesis [dpa]), then declined with the onset of secondary cell wall synthesis. The PPase was constitutively expressed through fiber development. Activity of the two proton-translocating-ATPases peaked at +15 dpa, whereas PPase activity peaked at +20 dpa, suggesting that all are involved in the process of cell expansion but with varying roles. Patterns of protein accumulation and enzyme activity for some of the proteins examined suggest posttranslational regulation through fiber development.


Figures

Figure 1
Figure 1
A, Autoradiographs of representative results of RPAs of cotton fiber RNA isolated throughout development. Developmental stage in dpa is noted above each lane (DPA). Probes used for RPAs are described in the text. Exposure times varied for each probe. Each assay contained 1 μg of cotton fiber total RNA. B, Quantification of RPAs by phosphor imagery. Bars represent the averages of at least three assays quantified by a Fuji phosphor imager and expressed relative to the highest value. Lines extending above the bars represent the sd. Developmental stage in dpa is noted at the bottom of each lane (DPA). Intensities of the 18S rRNA RPA products are included for comparison in A, but were not used to normalize the values for the other probes.
Figure 2
Figure 2
Immunoblots of protein purified from cotton locules throughout development. Developmental stage in dpa is noted above each lane (DPA). The V-ATPase blot was probed with a mixture of antibodies raised to the 69-kD subunit and antibodies to the 57-kD subunit. Protein for the PM H+-ATPase blot was from microsomes (14 μg of protein per lane). Protein for the V-ATPase, PPase, and MIP blots was from tonoplast-enriched membranes (8 μg of protein per lane). Total soluble protein was used for blots probed with PEPCase and α-tubulin antibodies (50 μg of protein per lane).
Figure 3
Figure 3
Quantification of signal from immunoblots by scanning densitometry. The intensity of bands of the correct size on immunoblots was quantified using a scanning densitometer (Bio-Rad) and is expressed as a percentage of the highest value, which was set at 100% for each repetition. Values are the averages of quantifications of at least three blots for each antibody, and bars above and below each point represent one sd. Values in the V-ATPase panel represent quantification of the 69-kD subunit (•) and the 57-kD subunit (▪). In the PEPCase panel, quantifications of the 100-kD band (•) and the 95-kD band (▪) are shown. Developmental stage in dpa is noted on the x axis (DPA).
Figure 4
Figure 4
Enzyme activity in protein extracts from developing cotton locules. Each point represents the average of at least three independent assays, with bars above and below representing one sd. Purified PM was used for the PM H+-ATPase assays, whereas tonoplast-enriched membranes were used for V-ATPase and PPase assays. Total soluble protein was assayed for PEPCase activity. The average specific activity of PM H+-ATPase at 15 dpa was 152.4 ± 26.6 nmol Pi mg−1 min−1, of V-ATPase at 15 dpa was 103.7 ± 23.4 nmol Pi mg−1 min−1, of PPase at 20 dpa was 142.3 ± 27.4 nmol PPi mg−1 min−1, and of PEPCase at −1 dpa was 0.1 ± 0.01 unit mg−1, where 1 unit equals the oxidation of 1 μmol NADH min−1 using a molar extinction coefficient of 6.22 × 10³.

References

    1. Albert HA, Martin T, Sun SSM. Structure and expression of a sugarcane gene encoding a housekeeping phosphoenolpyruvate carboxylase. Plant Mol Biol. 1992;20:663–671. - PubMed
    1. Ames BN. Assay of inorganic phosphate, total phosphate, and phosphatases. Methods Enzymol. 1966;8:115–118.
    1. Barkla BJ, Pantoja O. Physiology of ion transport across the tonoplast of higher plants. Annu Rev Plant Physiol Plant Mol Biol. 1996;47:159–184. - PubMed
    1. Basra AS, Malik CP. Development of the cotton fiber. Int Rev Cytol. 1984;89:65–113.
    1. Bennett AB, Leigh RA, Spanswick RM. H+-ATPase from vacuolar membranes of higher plants. Methods Enzymol. 1988;157:579–590. - PubMed

Publication types

MeSH terms

Substances

LinkOut - more resources