

Photosystem II cyclic heterogeneity and photoactivation in the diazotrophic, unicellular cyanobacterium cyanothece species ATCC 51142
- PMID: 9536074
- PMCID: PMC35064
- DOI: 10.1104/pp.116.4.1551
Photosystem II cyclic heterogeneity and photoactivation in the diazotrophic, unicellular cyanobacterium cyanothece species ATCC 51142
Abstract
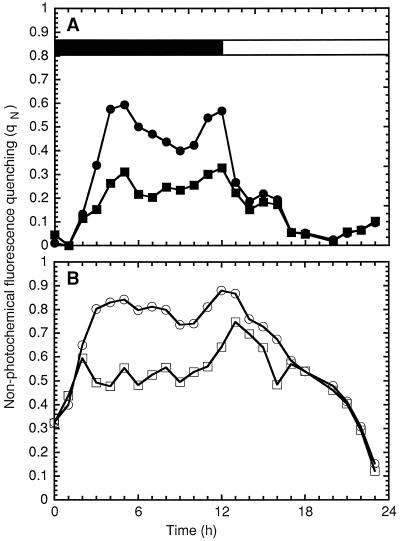
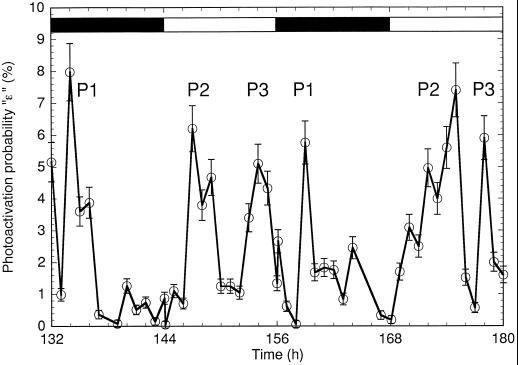
The unicellular, diazotrophic cyanobacterium Cyanothece sp. ATCC 51142 demonstrated important modifications to photosystem II (PSII) centers when grown under light/dark N2-fixing conditions. The properties of PSII were studied throughout the diurnal cycle using O2-flash-yield and pulse-amplitude-modulated fluorescence techniques. Nonphotochemical quenching (qN) of PSII increased during N2 fixation and persisted after treatments known to induce transitions to state 1. The qN was high in cells grown in the dark, and then disappeared progressively during the first 4 h of light growth. The photoactivation probability, epsilon, demonstrated interesting oscillations, with peaks near 3 h of darkness and 4 and 10 h of light. Experiments and calculations of the S-state distribution indicated that PSII displays a high level of heterogeneity, especially as the cells prepare for N2 fixation. We conclude that the oxidizing side of PSII is strongly affected during the period before and after the peak of nitrogenase activity; changes include a lowered capacity for O2 evolution, altered dark stability of PSII centers, and substantial changes in qN.
Figures
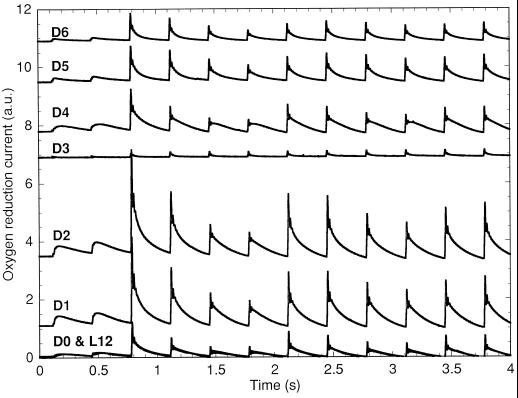
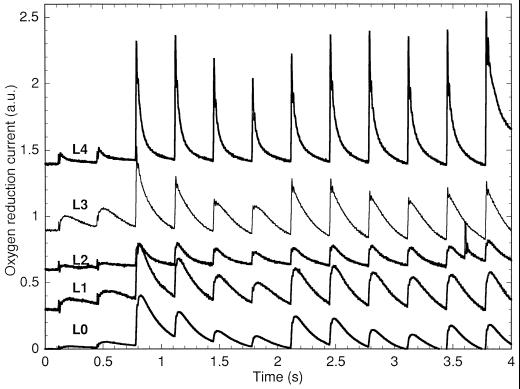

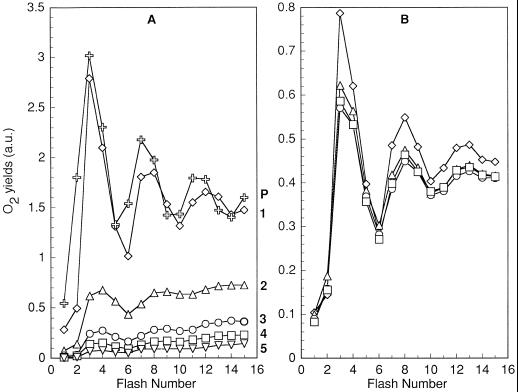
 ). B, After
controlling light leakages during centrifugation and sample
manipulation (⋄); after a subsequent 30 s of darkness (▵);
after an additional 30 s of darkness following the previous
experiment (□ and ○).
). B, After
controlling light leakages during centrifugation and sample
manipulation (⋄); after a subsequent 30 s of darkness (▵);
after an additional 30 s of darkness following the previous
experiment (□ and ○).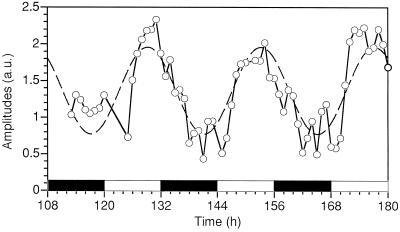
References
-
- Arnon DI, McSwain BD, Tsujimoto HY, Wada K. Photochemical activity and components of membrane preparations from blue-green algae I: coexistence of two photosystems in relation to chlorophyll aand removal of phycocyanin. Biochim Biophys Acta. 1974;357:231–245. - PubMed
-
- Bader KP. Physiological and evolutionary aspects of the H2O/H2O2-cycle in cyanobacteria. Biochim Biophys Acta. 1994;1188:213–219.
-
- Bader KP, Thibault P, Schmid GH. A study on oxygen evolution and on the S-state distribution in thylakoid preparations of the filamentous blue-green alga Oscillatoria chalybea. Z Naturforsch. 1983;38c:778–792.
-
- Bergman B, Gallon JR, Rai AN, Stal LJ. N2fixation by non-heterocystous cyanobacteria [review] FEMS Microbiol Rev. 1997;19:139–185.
-
- Burnap RL, Qian M, Pierce C. The manganese-stabilizing protein of photosystem II modifies the in vivo deactivation and photoactivation kinetics of the H2O oxidation complex in Synechocystissp. PCC 6803. Biochemistry. 1996;35:874–882. - PubMed
LinkOut - more resources
Full Text Sources
