. 1998 Apr;116(4):1573-83.
doi: 10.1104/pp.116.4.1573.

Differential regulation of sugar-sensitive sucrose synthases by hypoxia and anoxia indicate complementary transcriptional and posttranscriptional responses

Affiliations

Differential regulation of sugar-sensitive sucrose synthases by hypoxia and anoxia indicate complementary transcriptional and posttranscriptional responses

Y Zeng et al. Plant Physiol. 1998 Apr.

Abstract

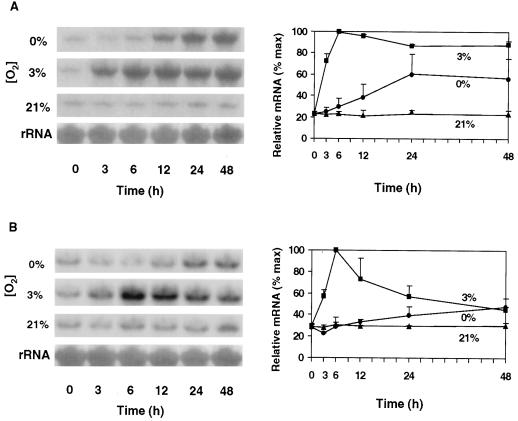
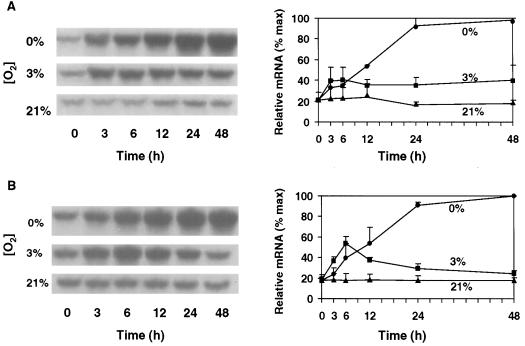
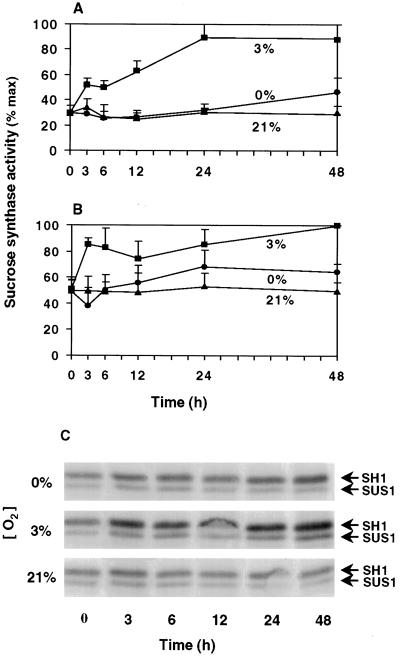
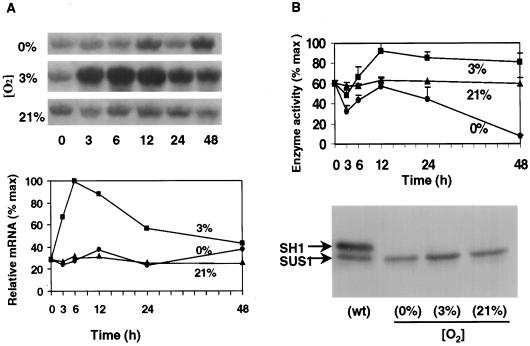
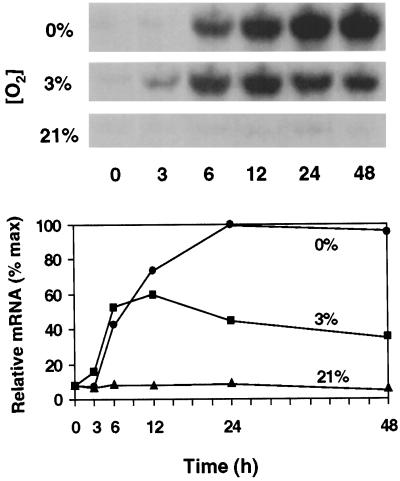
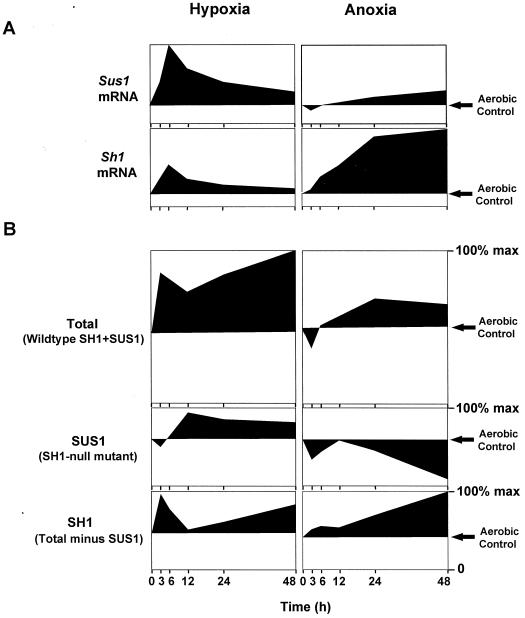
The goal of this research was to resolve the hypoxic and anoxic responses of maize (Zea mays) sucrose (Suc) synthases known to differ in their sugar regulation. The two maize Suc synthase genes, Sus1 and Sh1, both respond to sugar and O2, and recent work suggests commonalities between these signaling systems. Maize seedlings (NK508 hybrid, W22 inbred, and an isogenic sh1-null mutant) were exposed to anoxic, hypoxic, and aerobic conditions (0, 3, and 21% O2, respectively), when primary roots had reached approximately 5 cm. One-centimeter tips were excised for analysis during the 48-h treatments. At the mRNA level, Sus1 was rapidly up-regulated by hypoxia (approximately 5-fold in 6 h), whereas anoxia had less effect. In contrast, Sh1 mRNA abundance increased strongly under anoxia (approximately 5-fold in 24 h) and was much less affected by hypoxia. At the enzyme level, total Suc synthase activity rose rapidly under hypoxia but showed little significant change during anoxia. The contributions of SUS1 and SH1 activities to these responses were dissected over time by comparing the sh1-null mutant with the isogenic wild type (Sus+, Sh1+). Sh1-dependent activity contributed most markedly to a rapid protein-level response consistently observed in the first 3 h, and, subsequently, to a long-term change mediated at the level of mRNA accumulation at 48 h. A complementary midterm rise in SUS1 activity varied in duration with genetic background. These data highlight the involvement of distinctly different genes and probable signal mechanisms under hypoxia and anoxia, and together with earlier work, show parallel induction of "feast and famine" Suc synthase genes by hypoxia and anoxia, respectively. In addition, complementary modes of transcriptional and posttranscriptional regulation are implicated by these data, and provide a mechanism for sequential contributions from the Sus1 and Sh1 genes during progressive onset of naturally occurring low-O2 events.


Figures

Figure 1
Figure 1
Time course and extent of change in Sus1 mRNA levels in root tips of intact hybrid (NK508) (A) and inbred (W22) (B) maize seedlings under 0% O2 (anoxic), 3% O2 (hypoxic), or 21% O2 (aerobic) conditions. Treatments were initiated after 5 to 7 d of germination, respectively, when roots had reached approximately 5 cm. The 1-cm tips of primary roots were excised at each time point (approximately 90 tips and 0.63 g). RNA gel blots were visualized by autoradiography, and abundance of 32P-mRNA was quantified with a phosphor imager. Ten micrograms of total RNA was loaded in each lane and uniformity was verified by visualization of rRNA bands. For each experiment, data from the three O2 treatments were obtained from the same blot. Error bars represent the means ± se of two to three experiments.
Figure 2
Figure 2
Time course and extent of change in Sh1 mRNA levels in root tips of intact hybrid (NK508) (A) and inbred (W22) (B) maize seedlings under 0% O2 (anoxic), 3% O2 (hypoxic), or 21% O2 (aerobic) conditions. Blots were identical to those probed with Sus1 in Figure 1, except that mRNA was hybridized with a cDNA for Sh1. Visualization and quantification were also as in Figure 1. Error bars represent the means ± se of two to three experiments.
Figure 3
Figure 3
Influence of low O2 on Suc synthase activity and protein levels. Time course of the change in relative Suc synthase activities in root tips of intact hybrid (NK508) (A) and inbred (W22) (B) maize seedlings under 0% O2 (anoxic), 3% O2 (hypoxic), or 21% O2 (aerobic) conditions. Data are the means ± se of two to three experiments, and values are plotted as a percentage of the maximum activity (137 and 152 μmol Suc g−1 fresh weight h−1 for NK508 and W22, respectively). Profiles were similar if expressed per unit of protein. C, Protein gel-blot analysis of SH1 and SUS1 proteins from NK508 seedlings. Five micrograms of protein was loaded in each lane, separated via SDS-PAGE, transferred to a nitrocellulose membrane, and hybridized with antibody cross-reactive to both SH1 and SUS1 proteins, but preferential for SH1 (Koch et al., 1992). Results were similar for the W22 inbred line (data not shown).
Figure 4
Figure 4
Time course of changes in Sus1 mRNA levels and SUS1 enzyme activity in the sh1-null mutant under 0% O2 (anoxic), 3% O2 (hypoxic), or 21% O2 (aerobic) conditions. A, Relative abundance of Sus1 mRNA. Low-O2 treatments and sampling, as well as visualization and quantification of blots, were as in Figure 1. B, SUS1-Suc synthase activities and protein gel-blot analyses. Data are the means ± se of two to three experiments, and values are plotted as percentage of maximum activity (77 μmol Suc g−1 fresh weight h−1 for the sh1-null mutant). Profiles were similar if expressed per unit of protein. For the protein gel blot, 5 μg of protein was applied to each lane, separated with SDS-PAGE, transferred to a nitrocellulose membrane, and hybridized with antibody cross-reactive to both SH1 and SUS1 proteins, but preferential for SH1 (Koch et al., 1992). An aerobic, wild-type control from NK508 is shown for comparison with 12-h samples from the sh1-null mutant. Results from the sh1-null mutant were similar at 24 h (not shown).
Figure 5
Figure 5
Time course and extent of change in abundance of Adh1 mRNA in root tips of intact maize seedlings of NK508 as a marker for O2 status under 0% O2 (anoxic), 3% O2 (hypoxic), and 21% O2 (aerobic) conditions. Blots were identical to those shown in Figure 1, except that mRNA was hybridized with a cDNA for Adh1. Visualization and quantification were also as in Figure 1.
Figure 6
Figure 6
Dissection of contributions from Sus1 and Sh1 at the mRNA (A) and enzyme activity levels (B) under hypoxia (3% O2) and anoxia (0% O2) relative to aerobic controls (21% O2). Profiles at the mRNA level represent data from the isogenic W22 inbred line (derived from Figs. 1B and 2B) and are pictured for comparative purposes. Profiles at the enzyme activity level represent data from total Suc synthase (SH1 plus SUS1) in the wild-type W22 inbred line (derived from Fig. 3B), data from SUS1 alone in an isogenic sh1-null mutant (derived from Fig. 4B), and SH1-dependent activity (determined from comparison of SUS1 activity to total Suc synthase activity in the isogenic wild type). That Sus1 mRNA and SUS1 protein level responded similarly in wild-type or mutant material is indicated in Figures 1A, 3C, and 4B. Profiles are expressed as a percentage of the maximum activities for SUS1 and SH1 together, SUS1 alone, or SH1-dependent activity, which were 152, 77, and 75 μmol Suc g−1 fresh weight h−1, respectively. Decreases in activity relative to aerobic controls are shown as profiles extending below this aerobic reference line in each figure.

Similar articles

Cited by

References

    1. Andrews DL, Drew MC, Johnson JR, Cobb BG. The response of maize seedlings of different ages to hypoxic and anoxic stress. Changes in induction of Adh mRNA, ADH activity, and survival of anoxia. Plant Physiol. 1994;105:53–60. - PMC - PubMed
    1. Bailey-Serres J, Kloeckner-Gruissem B, Freeling M. Genetic and molecular approaches to the study of the anaerobic responses and tissue specific gene expression in maize. Plant Cell Environ. 1988;11:351–357.
    1. Bouny JM, Saglio P. Glycolytic flux and hexokinase activities in anoxic maize root tips acclimated by hypoxic pretreatment. Plant Physiol. 1996;111:187–194. - PMC - PubMed
    1. Bradford MM. A rapid and sensitive method for the quantitation of microgram quantities of protein utilizing the principle of protein-dye binding. Anal Biochem. 1976;72:248–254. - PubMed
    1. Chourey PS, Taliercio EW. Epistatic interaction and functional compensation between the two tissue- and cell-specific sucrose synthase genes in maize. Proc Natl Acad Sci. 1994;91:7917–7921. - PMC - PubMed

LinkOut - more resources