. 1998 Apr;180(7):1841-7.
doi: 10.1128/JB.180.7.1841-1847.1998.

Novel assay reveals multiple pathways regulating stress-induced accumulations of inorganic polyphosphate in Escherichia coli

Affiliations

Novel assay reveals multiple pathways regulating stress-induced accumulations of inorganic polyphosphate in Escherichia coli

D Ault-Riché et al. J Bacteriol. 1998 Apr.

Abstract

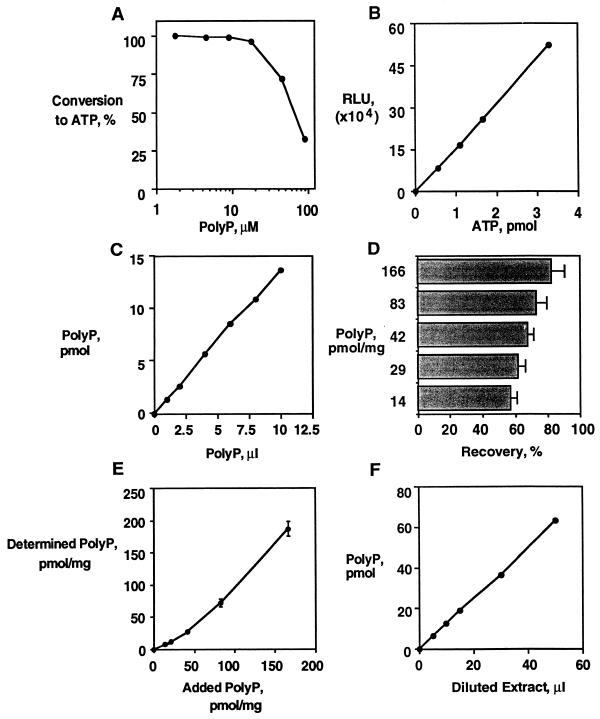
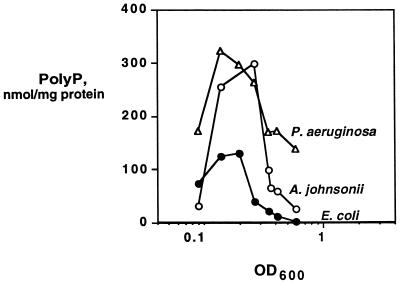
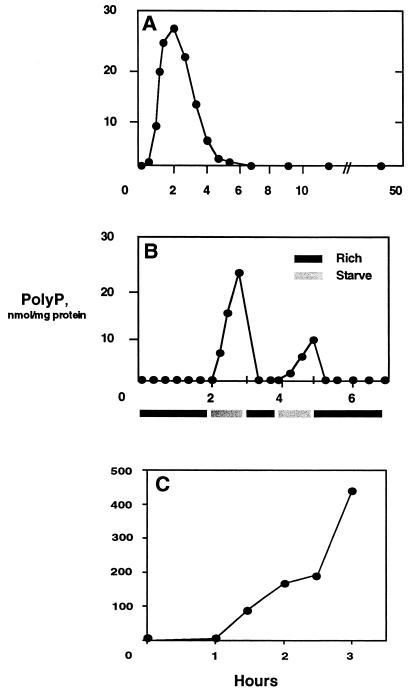
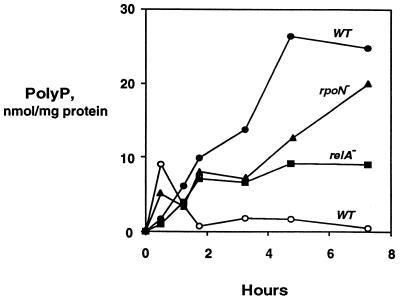
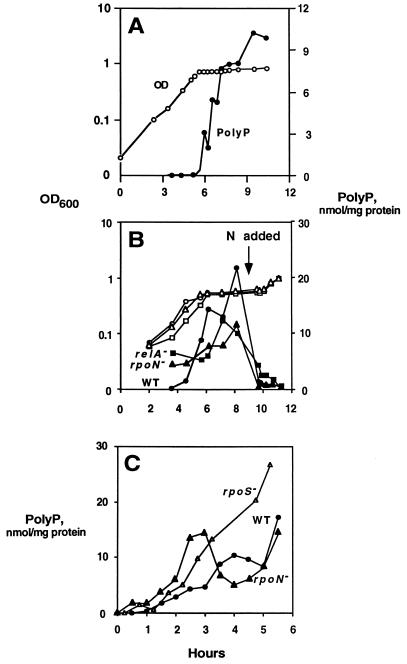
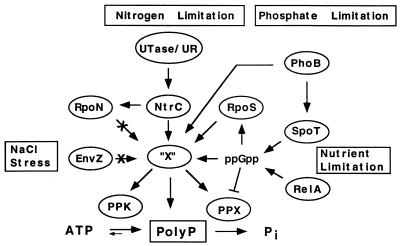
A major impediment to understanding the biological roles of inorganic polyphosphate (polyP) has been the lack of sensitive definitive methods to extract and quantitate cellular polyP. We show that polyP recovered in extracts from cells lysed with guanidinium isothiocynate can be bound to silicate glass and quantitatively measured by a two-enzyme assay: polyP is first converted to ATP by polyP kinase, and the ATP is hydrolyzed by luciferase to generate light. This nonradioactive method can detect picomolar amounts of phosphate residues in polyP per milligram of extracted protein. A simplified procedure for preparing polyP synthesized by polyP kinase is also described. Using the new assay, we found that bacteria subjected to nutritional or osmotic stress in a rich medium or to nitrogen exhaustion had large and dynamic accumulations of polyP. By contrast, carbon exhaustion, changes in pH, temperature upshifts, and oxidative stress had no effect on polyP levels. Analysis of Escherichia coli mutants revealed that polyP accumulation depends on several regulatory genes, glnD (NtrC), rpoS, relA, and phoB.


Figures

FIG. 1
FIG. 1
PolyP assay. (A) Conversion of [32P]polyP to ATP. Various concentrations of [32P]polyP were reacted with 24,000 U of PPK and 200 μM ADP in a 0.1-ml reaction mixture for 40 min at 37°C. [32P]polyP and [32P]ATP were separated by TLC and quantitated by scintillation counting. Values are averages of triplicate reactions. (B) ATP estimation with luciferase. A standard curve for ATP (0, 0.55, 1.1, 1.65, 3.3 pmol of ATP) was prepared in 100 mM Tris-HCl (pH 8.0)–4 mM EDTA and added to an equal volume of luciferase reaction mixture, and the luminescence was measured. A linear relationship with a correlation coefficient of 1.00 was obtained. (C) Quantitation of [32P]polyP. [32P]polyP was added to a 0.1-ml reaction mixture containing 12,000 U of PPK–5 μM ADP and incubated at 37°C for 40 min and then 90°C for 5 min and diluted 100-fold with 100 mM Tris-HCl (pH 8.0)–4 mM EDTA. Then 0.1 ml of the diluted reaction mixture was added to 0.1 ml of luciferase reaction mixture and the luminescence was measured. A linear relationship with a correlation coefficient of 1.00 was obtained. (D) Recovery of polyP from Glassmilk. [32P]polyP was added at various concentrations to GITC lysates of ppk ppx cells from 0.5-ml cultures (OD600 of 1.1), and polyP was extracted. Radioactivity eluted and remaining on the Glassmilk pellet was used to estimate recovery. Results are averages of triplicate assays. (E) Variation of polyP assay. PolyP extracts as for panel D were analyzed by conversion with PPK and ADP followed by ATP estimation with luciferase. Results are averages of triplicate assays and include error bars. (F) Quantitation of polyP extracts. ppk ppx cells complemented with a plasmid overexpressing the ppk gene (pGexPPK) were grown to an OD600 of 0.7 and then induced to express PPK by the addition of isopropyl-β-d-thiogalactopyranoside to 50 μM and grown at 30°C for 2 h. PolyP was extracted and analyzed from 1-ml cultures as described in Materials and Methods. Serial dilutions were initially assayed to identify an appropriate dilution of polyP to be examined. A second round of analysis gave a linear correlation over six determinations with a correlation coefficient of 1.00.
FIG. 2
FIG. 2
Phosphate and amino acid limitation. Cells were grown overnight in MOPS medium and then reinoculated into the same medium with limited amounts of phosphate (0.1 mM) and amino acids (2 μg/ml). PolyP was assayed as described in Materials and Methods. E. coli is strain MG1655.
FIG. 3
FIG. 3
Nutrient downshifts. (A) E. coli MG1655 cells grown to mid-log phase in LB were downshifted by resuspension in MOPS medium without a carbon source or amino acids. (B) E. coli MG1655 cells grown to mid-log phase in LB were downshifted as above and then upshifted by resuspension in LB. Growth in rich medium (LB) or SM (MOPS medium without a carbon source or amino acids) is indicated by dark or light bars, respectively. (C) E. coli MG1655 cells grown to mid-log phase in LB were downshifted to MOPS medium with low phosphate (0.1 mM) and without amino acids. PolyP was assayed as described in Materials and Methods.
FIG. 4
FIG. 4
Osmotic stress. PolyP was measured for E. coli cultures grown to mid-log phase in LB and then resuspended in LB containing 1.17 M NaCl (closed symbols) or 0.85 M NaCl (open circles). PolyP was assayed as described in Materials and Methods. Strains are described in Table 1.
FIG. 5
FIG. 5
Nitrogen limitation. (A) E. coli MG1655 cells were inoculated into SM containing limited nitrogen. (B) Cells were grown as for panel A, and nitrogen was added to the culture at 9.5 h. (C) Cells were grown in SM to mid-log phase and then shifted to SM lacking nitrogen and amino acids. All cultures stopped growing after the shift.
FIG. 6
FIG. 6
Model for stress-induced polyP accumulation. Nitrogen is regulated by a signal cascade involving Utase/UR, NtrB, NtrC, and RpoN. NtrC, together with RpoS and PhoB, is needed for polyP accumulation in response to nitrogen limitation. Involvement of a sigma factor (RpoS) implies activation of an additional factor (“X”) which could lead to polyP accumulation by direct interaction with polyP, inhibition of PPX, stimulation of PPK, or a combination of all three. Under nutrient limitation, ppGpp accumulates by RelA and SpoT actions, which can lead to polyP accumulation by PPX inhibition and/or RpoS activation. Failure to accumulate polyP when ppGpp and RpoS levels are high (such as under carbon starvation) implies the presence of additional regulator(s). Osmotic stress triggers polyP accumulation through a mechanism that does not involve EnvZ, the osmotic sensor.

References

    1. Ahn K, Kornberg A. Polyphosphate kinase from Escherichia coli. Purification and demonstration of a phosphoenzyme intermediate. J Biol Chem. 1990;265:11734–11739. - PubMed
    1. Akiyama M, Crooke E, Kornberg A. An exopolyphosphatase of Escherichia coli. J Biol Chem. 1993;268:633–639. - PubMed
    1. Bueno R, Pahel G, Magasanik B. Role of glnB and glnD gene products in regulation of the glnALG operon of Escherichia coli. J Bacteriol. 1985;164:816–822. - PMC - PubMed
    1. Cashel M, Gentry D R, Hernandez V J, Vinella D. The stringent response. In: Neidhardt F C, Curtiss III R, Ingraham J L, Lin E C C, Low K B, Magasanik B, Reznikoff W S, Riley M, Shaechter M, Umbarger H E, editors. Escherichia coli and Salmonella typhimurium: cellular and molecular biology. Washington, D.C: American Society for Microbiology; 1996. pp. 1458–1496.
    1. Chapman A G, Atkinson D E. Adenine nucleotide concentrations and turnover rates. Their correlation with biological activity in bacteria and yeast. Adv Microbiol Physiol. 1977;15:253–306. - PubMed

MeSH terms

LinkOut - more resources