. 1998 Apr 14;95(8):4453-7.
doi: 10.1073/pnas.95.8.4453.

Instability of signaling resolution models of parent-offspring conflict

Affiliations

Instability of signaling resolution models of parent-offspring conflict

M A Rodríguez-Gironés et al. Proc Natl Acad Sci U S A. .

Abstract

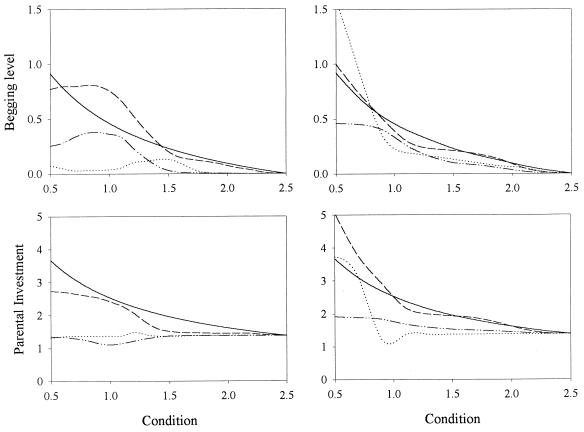
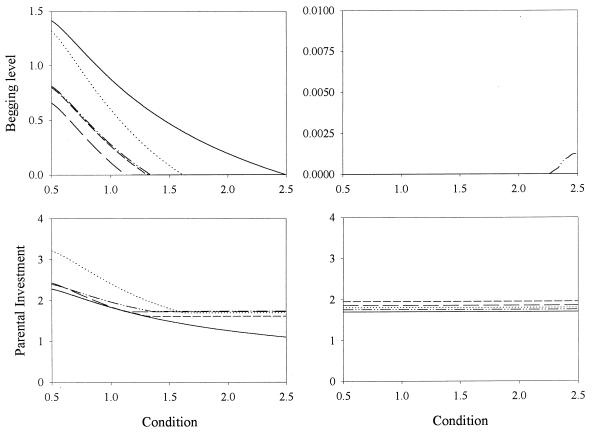
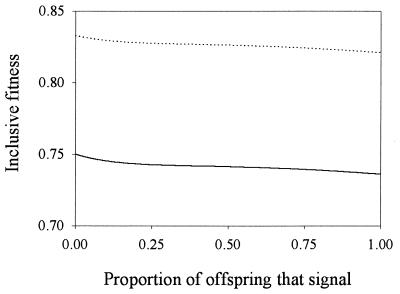
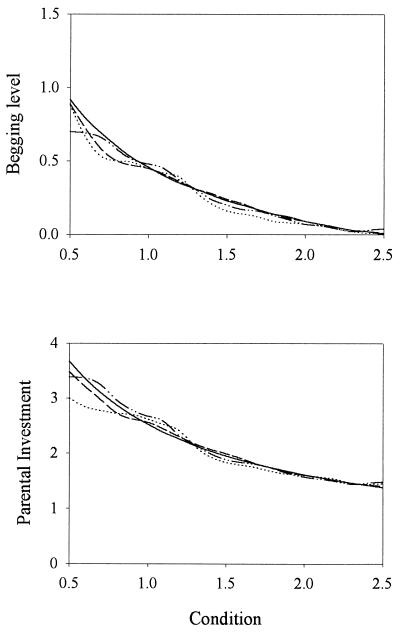
Recent signaling resolution models of parent-offspring conflict have provided an important framework for theoretical and empirical studies of communication and parental care. According to these models, signaling of need is stabilized by its cost. However, our computer simulations of the evolutionary dynamics of chick begging and parental investment show that in Godfray's model the signaling equilibrium is evolutionarily unstable: populations that start at the signaling equilibrium quickly depart from it. Furthermore, the signaling and nonsignaling equilibria are linked by a continuum of equilibria where chicks above a certain condition do not signal and we show that, contrary to intuition, fitness increases monotonically as the proportion of young that signal decreases. This result forces us to reconsider much of the current literature on signaling of need and highlights the need to investigate the evolutionary stability of signaling equilibria based on the handicap principle.


Figures

Figure 1
Figure 1
Two-round contest. Mean begging level (Upper) and parental investment (Lower) plotted as a function of chick’s condition when population size was N = 100 (Left–shows average over five runs) and N = 1,000 (Right–single run). The solid line represents the initial condition and the others values after 1,000, 5,000 (dashed lines) and 10,000 (dotted lines) generations. Young condition c was selected from a rectangular distribution (0.5–2.5) (2). Young and parental inclusive fitness (2) were calculated according to Fch = (1 − e−c⋅y) − Vxr⋅γ⋅y and Fp = (1 − e−c⋅y) − V⋅x − γ⋅y, respectively (V = 0.1, γ = 0.08, r = 0.5). The contest started at the signaling equilibrium. Signaling strategies were coded as interpolation tables which could mutate with probability 0.05. An offspring strategy coded for the begging intensities x(ci) associated with evenly distributed conditions ci (i = 0, … nc; c0 = 0.5, cnc = 2.5; nc = 20 for N = 100 and nc = 10 for N = 1,000), and a parental strategy coded for the parental investment levels y(xi) associated with evenly distributed begging intensities xi (i = 0, … nx; x0 = 0.0, xnx = 2.5; nx = 50 for N = 100 and nx = 25 for N = 1,000). The begging strategy for a chick with condition c and the parental response to a begging intensity x were determined from the x(ci) and y(xi), respectively, by polynomial interpolation (third order). In case of mutation, a “bump” was added to the table by randomly choosing an integer J (uniform distribution between 0 and nc or nx) and a real z (standard normal distribution) and adding to every entry i in the table the amount 0.2⋅(0.05 + w)⋅z⋅exp[−(8⋅(iJ)/nw)2] where w = x(cJ) and nw = nc for the offspring strategy and w = y(xJ) and nw = nx for the parental strategy. To avoid ending with oscillating strategies, the interpolation tables were smoothed to ensure that they had at most one maximum and one minimum (the highest and lowest values in the table were looked for, and terms were ordered in the three sections: from first term to first extremum, between the two extrema, and between second extremum and end of table).
Figure 2
Figure 2
Evolutionary dynamics of begging. Mean begging level (Upper) and parental investment (Lower) are plotted as a function of chick’s condition when the simulation was started at the signaling (Left) and nonsignaling (Right) equilibrium. Note that, because of the specific life history chosen for the simulation, the signaling equilibrium is given by formula image The solid line represents the initial condition and the others, values after 250,000, 500,000, 750,000 (dashed lines), and 1,000,000 (dotted lines) generations. The population had 1,225 territories. Young condition c was selected from a rectangular distribution (0.5–2.5) (2). Young and parental fitness (2) were calculated according to Fch = (1 − ec⋅y) − Vx and Fp = 1 − γ⋅y, respectively (V = 0.1, γ = 0.08). Young dispersed at random. Signaling strategies could be any linear combination of the signaling equilibrium solution and polynomials of degree up to five. The genes coded for the coefficients of the terms, which could mutate with probability 0.001. In case of mutation, a single coefficient k was selected a random and a value (k + 0.05)⋅0.2⋅z was added to it, where z was a random variate chosen from a standard normal distribution. Mating and dispersal were random, irrespective of “distance” between territories. Qualitatively similar results were obtained with haploid and diploid individuals, when strategies were coded as neural networks or interpolation tables, and when mating and dispersal were restricted to neighboring territories.
Figure 3
Figure 3
Inclusive fitness of parents (solid line) and offspring (dotted line) at the partially signaling equilibria, plotted as a function of the proportion of offspring that signal. Fitness functions and parameter values as in ref. .
Figure 4
Figure 4
Importance of stochasticity. Simulations as in Fig. 1 (N = 100), except that the payoff of a strategy was calculated as the average inclusive fitness over 25 random values of c. Similar results were obtained when the simulations were run as in Fig. 2.

References

    1. Godfray H C J. Nature (London) 1991;352:328–330.
    1. Godfray H C J. Am Nat. 1991;146:1–24.
    1. Macnair M R, Parker G A. Anim Behav. 1979;27:1202–1209.
    1. Krebs J R, Dawkins R. In: Behavioral Ecology, An Evolutionary Approach. 2nd Ed. Krebs J R, Davies N B, editors. Oxford: Blackwell Scientific; 1984. pp. 380–402.
    1. Harper A B. Am Nat. 1986;128:99–114.

Publication types

LinkOut - more resources