. 1998 Apr 14;95(8):4772-7.
doi: 10.1073/pnas.95.8.4772.

Architectural specificity in chromatin structure at the TATA box in vivo: nucleosome displacement upon beta-phaseolin gene activation

Affiliations

Architectural specificity in chromatin structure at the TATA box in vivo: nucleosome displacement upon beta-phaseolin gene activation

G Li et al. Proc Natl Acad Sci U S A. .

Abstract

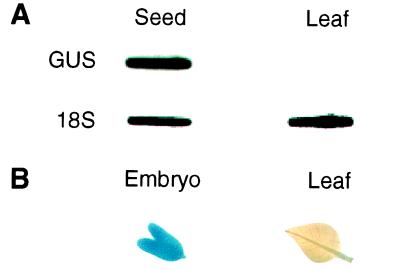
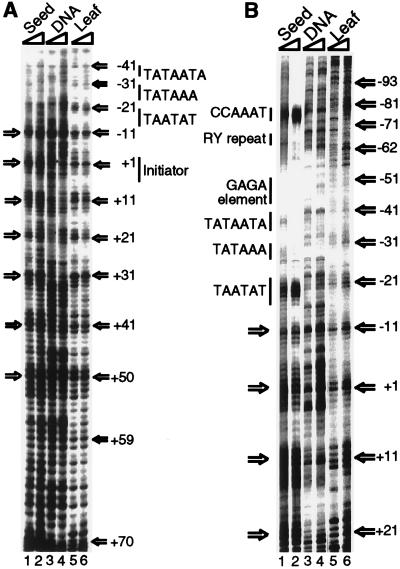
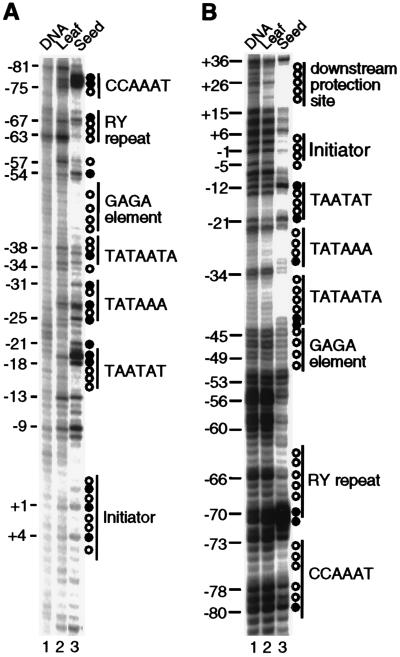
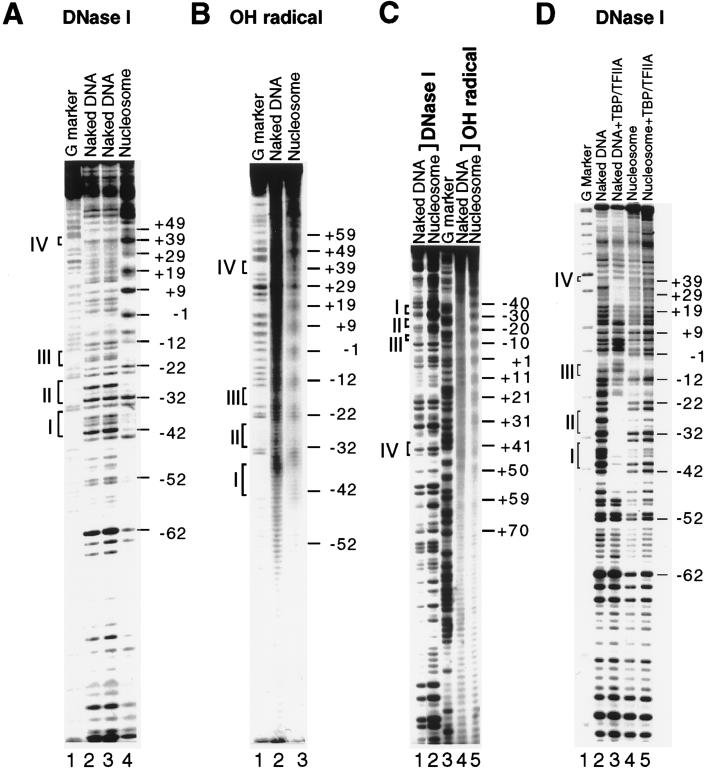
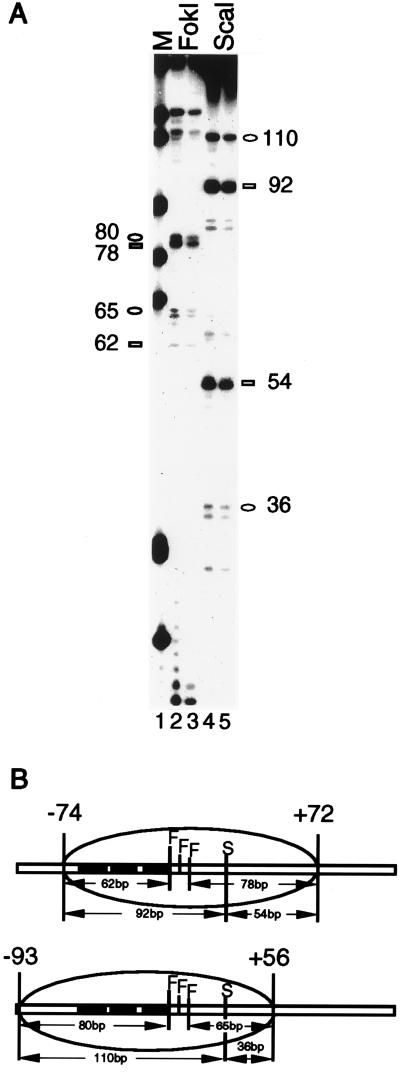
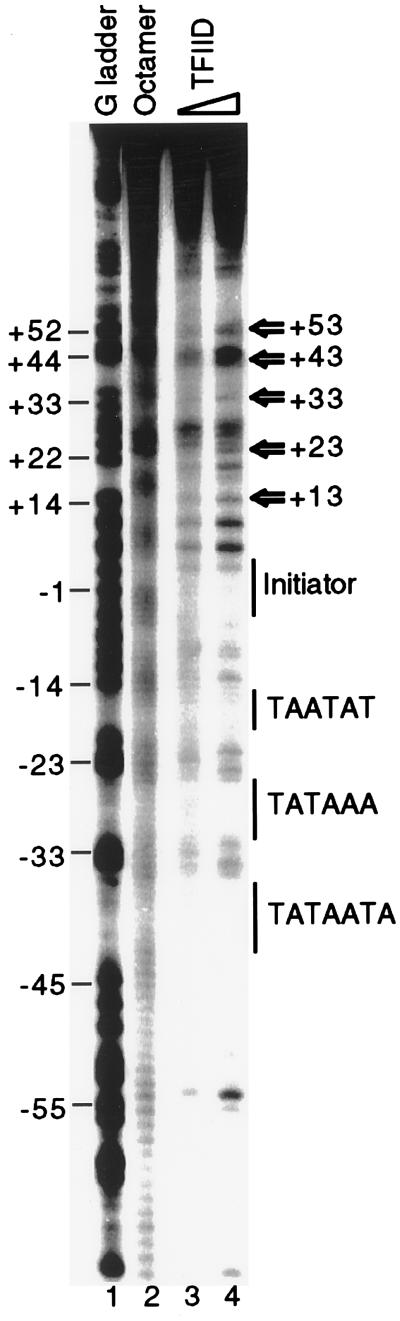
Extensive studies of the beta-phaseolin (phas) gene in transgenic tobacco have shown that it is highly active during seed embryogenesis but is completely silent in leaf and other vegetative tissues. In vivo footprinting revealed that the lack of even basal transcriptional activity in vegetative tissues is associated with the presence of a nucleosome that is rotationally positioned with base pair precision over three phased TATA boxes present in the phas promoter. Positioning is sequence-dependent because an identical rotational setting is obtained upon nucleosome reconstitution in vitro. A comparison of DNase I and dimethyl sulfate footprints in vivo and in vitro strongly suggests that this repressive chromatin architecture is remodeled concomitant with gene activation in the developing seed. This leads to the disruption of histone-mediated DNA wrapping and the assembly of the TATA boxes into a transcriptionally competent nucleoprotein complex.


Figures

Figure 1
Figure 1
The phas promoter drives expression in seed embryo but not in leaf tissue. (A) Transcriptional activity detected by run-on analysis using nuclei from mid-maturation embryos or leaves from a tobacco plant containing a single copy of −1470phas/uidA. Labeled run-on RNA was hybridized to a slot blot containing plasmid DNA encoding GUS or 18S ribosomal RNA. (B) Histochemical staining of a representative seed embryo and a leaf from the plant used in A. Blue color reveals accumulated GUS protein.
Figure 2
Figure 2
DNase I footprinting in vivo of the top strand of the phas promoter proximal region. Nuclei were isolated from seed or leaf tissue and treated with various levels of DNase I. DNA was then extracted and subjected to LMPCR. (A) DNase I footprinting of the +70 to −41 phas promoter region from seed nuclei (lanes 1 and 2) and leaf nuclei (lanes 5 and 6) with naked DNA as a reference (lanes 3 and 4), using primers annealed to the +90 region. The DNase I concentrations used were: lane 1, 6 units; lane 2, 12 units; lane 3, 1 unit; lane 4, 2 units; lane 5, 6 units; lane 6, 12 units. (B) DNase I footprinting of the +21 to −93 region of the phas promoter in seed nuclei (lanes 1 and 2) and leaf nuclei (lanes 5 and 6) with naked DNA as a control (lanes 3 and 4), using primers annealed to the +45 region. DNase I concentrations used were as in A. For both A and B, open arrows show DNase I sensitivity at intervals of 10 bp, a pattern characteristic of DNA wrapped around a nucleosome or TFIID. Base positions are numbered relative to the transcription start site, and potentially important cis-elements are labeled.
Figure 3
Figure 3
DMS footprinting in vivo reveals factor binding to the active but not the inactive phas proximal promoter. Intact seeds or leaves of tobacco transformed with phas-uidA were treated with DMS. DNA was extracted and treated with piperidine (DMS and piperidine-treated genomic DNA was used as a control), and LMPCR analysis of the indicated regions of the phas promoter (relative to the transcription start site) was conducted by using appropriate primers. (A) Top strand. (B) Bottom strand. Consensus cis-element sites are indicated together with protected residues (open circles) and hypersensitive residues (solid circles).
Figure 4
Figure 4
Nucleosome reconstituted in vitro on a proximal fragment of the phas promoter and its effect on TBP binding. (A) DNase I footprinting of the bottom strand. For DNase I footprinting, the AflIII-XbaI fragment (−112 to +141) from the phas promoter in pBluescript II was reconstituted into nucleosomes and then treated with DNase I (1.5 units). After digestion, the nucleosome-bound fraction was separated by electrophoresis through a 0.7% agarose gel. The relevant band was electroeluted and run on a 6% denaturing acrylamide gel. (B) Hydroxyl radical footprinting of the bottom strand. Nucleosome reconstitution was as in A. For hydroxyl radical footprinting, cleavage was carried out by the generation of radicals through the Fenton reaction. Subsequent steps were as for DNase I footprinting. (C) DNase I and hydroxyl radical footprinting of the top strand of the phas proximal promoter. Footprinting was carried out as in A and B. (D) Incorporation of the phas promoter into a nucleosome prevents the binding of TBP. Equimolar amounts (400 nm) of TBP and TFIIA were added either to naked DNA (lane 3), or to reconstituted nucleosomes (lane 5), and binding was assessed by DNase I footprinting. For AD, base positions are shown relative to the transcription start site. The phas TATA boxes, shown as brackets I to IV, are positioned at −41 to −35 (TATAATA), −32 to −25 (TATAAATA), −20 to −15 (TAATAT), and +37 to +43 (TATAATA).
Figure 5
Figure 5
Translational mapping of the nucleosome on the phas promoter. The AflIII-XbaI fragment (−112 to +141) from the phas promoter in pBluescript II was reconstituted into nucleosome. The resultant nucleosomal complex was treated with micrococcal nuclease (0.07 units), and the kinase-labeled products were loaded onto a 6% native polyacrylamide gel. The relevant band was excised and eluted. The DNA was then extracted with phenol and cleaved with either FokI or ScaI, and the products were separated on a 6% denaturing gel. (A) Two major translational settings were revealed. The FokI (lanes 2 and 3) or ScaI (lanes 4 and 5) fragment positions are denoted by a rectangle (for the −74/+72 setting) or an oval (for the −93/+56 setting). Lane 1 is a marker (M) lane containing MspI-digested pBR322. (B) Diagram of the two major translational positions. Solid rectangles denote TATA boxes. Restriction enzyme sites: F, FokI; S, ScaI.
Figure 6
Figure 6
Hydroxyl radical footprinting of the complex of TFIID with the phas promoter. Lane 1, G ladder with positions shown relative to the transcription start site; lane 2, cleavage of the phas fragment in a reconstituted nucleosome; lanes 3 and 4, cleavage of the fragment bound by 200 ng or 300 ng of TFIID, respectively.

References

    1. Grunstein M. Annu Rev Cell Biol. 1990;6:643–678. - PubMed
    1. Simpson R T. Nucleic Acids Res Mol Biol. 1991;40:143–184. - PubMed
    1. Felsenfeld G. Nature (London) 1992;355:219–224. - PubMed
    1. Owen-Hughes T, Workman J W. Crit Rev Eukaryotic Gene Expression. 1994;4:403–441. - PubMed
    1. Schild C, Claret F-X, Wahli W, Wolffe A P. EMBO J. 1993;12:423–433. - PMC - PubMed

LinkOut - more resources