

Different hepatitis C virus (HCV) RNA load profiles following seroconversion among injecting drug users without correlation with HCV genotype and serum alanine aminotransferase levels
- PMID: 9542901
- PMCID: PMC104653
- DOI: 10.1128/JCM.36.4.872-877.1998
Different hepatitis C virus (HCV) RNA load profiles following seroconversion among injecting drug users without correlation with HCV genotype and serum alanine aminotransferase levels
Abstract
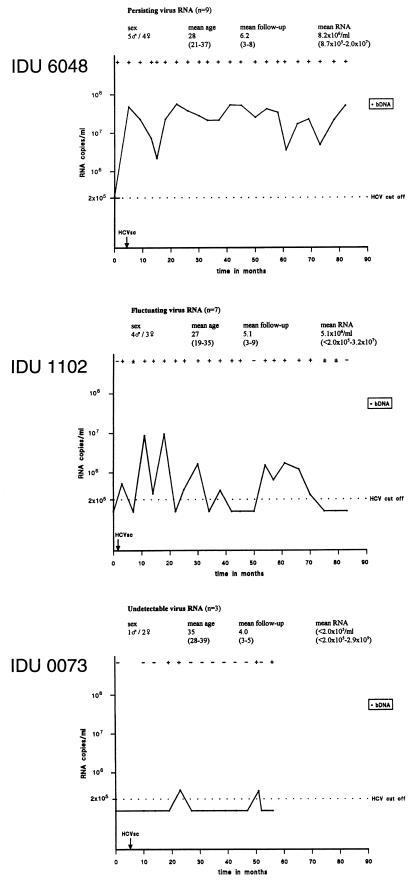
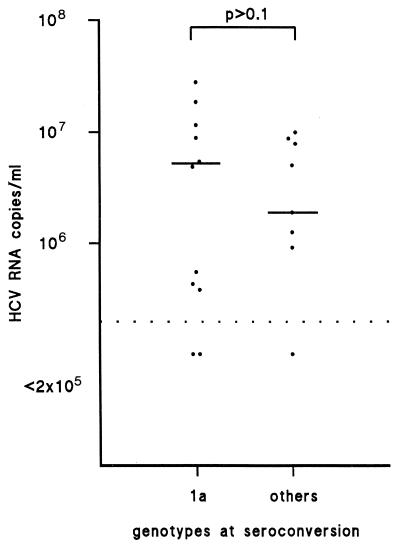
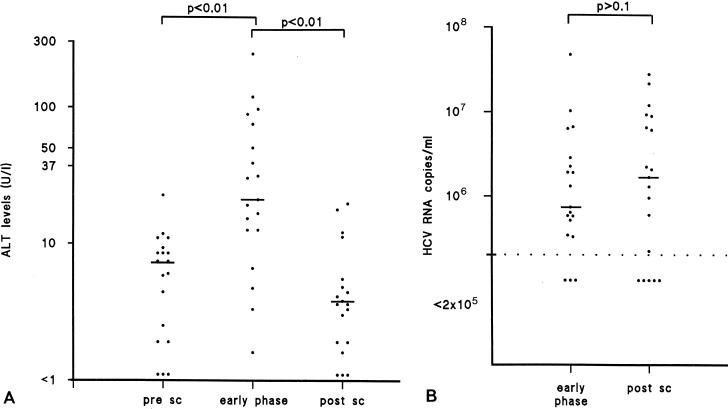
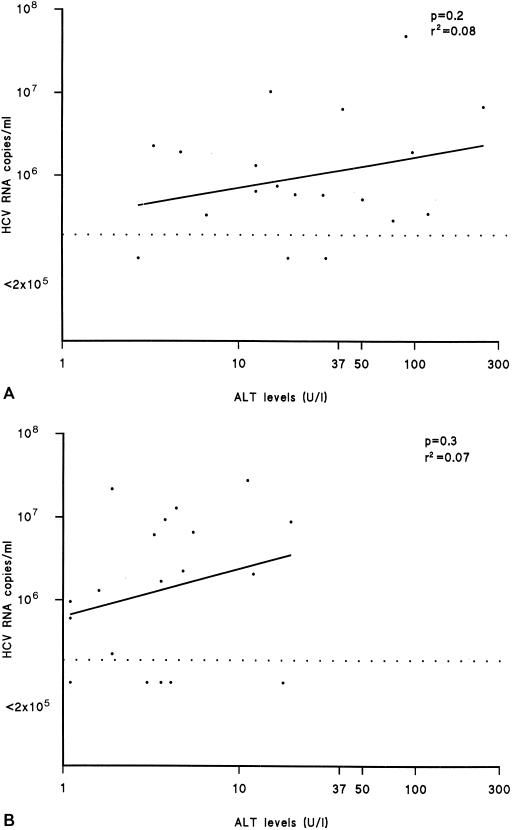
Hepatitis C virus (HCV) infection often persists in association with chronic hepatitis. Different factors have been proposed to determine the clinical outcome of HCV infection. The aim of this study was to examine three different factors of HCV infection among injecting drug users. Nineteen untreated HCV seroconverters were tested longitudinally for the presence of HCV RNA by reverse transcriptase (RT) PCR, and results were quantified by the branched-DNA (bDNA) assay. HCV genotypes were determined with the first sample taken after HCV seroconversion. To assess the natural course of infection, serum alanine aminotransferase (ALT) levels were measured at three stages in every individual. The concordance between bDNA and RT-PCR was 98.9%. Three distinct patterns were found, according to the HCV RNA load after seroconversion during a mean follow-up period of 5 years (range, 1 to 8 years). HCV genotype 1a was predominant (52.6%). There was a significant increase in serum ALT levels (mean 55.5 U/liter) in the early phase of HCV infection, compared with basal serum ALT levels before HCV seroconversion and at the end of the follow-up period. Three distinct HCV RNA load profiles were found, without apparent relationship to genotype and serum ALT levels in the first 5 years of HCV infection.
Figures
References
-
- Alter H J, Sanchez-Pescador R, Urdea M S, Wilber J C, Lagier R J, Di Bisceglie A M, Shih J W, Neuwald P D. Evaluation of branched DNA signal amplification for the detection of hepatitis C virus RNA. J Viral Hepatitis. 1995;2:121–132. - PubMed
-
- Attia M A M, Zekri A, Goudsmit J, Boom R, Khaled H M, Mansour M T, de Wolf F, El-Din H M, Sol C J A. Diverse patterns of recognition of hepatitis C virus core and nonstructural antigens by antibodies present in Egyptian cancer patients and blood donors. J Clin Microbiol. 1996;34:2665–2669. - PMC - PubMed
-
- Cahen D L, van Leeuwen D J, ten Kate F J W, Blok A P R, Oosting J, Chamuleau R A F M. Do serum ALAT values reflect the inflammatory activity in the liver of patients with chronic viral hepatitis? Liver. 1996;16:105–109. - PubMed
-
- Choo Q L, Kuo G, Weiner A J, Overby L R, Bradley D W, Houghton M. Isolation of a cDNA clone derived from a blood-borne non-A, non-B viral hepatitis genome. Science. 1989;244:359–362. - PubMed
Publication types
MeSH terms
Substances
LinkOut - more resources
Full Text Sources
