

Population dynamics of phenol-degrading bacteria in activated sludge determined by gyrB-targeted quantitative PCR
- PMID: 9546154
- PMCID: PMC106130
- DOI: 10.1128/AEM.64.4.1203-1209.1998
Population dynamics of phenol-degrading bacteria in activated sludge determined by gyrB-targeted quantitative PCR
Abstract
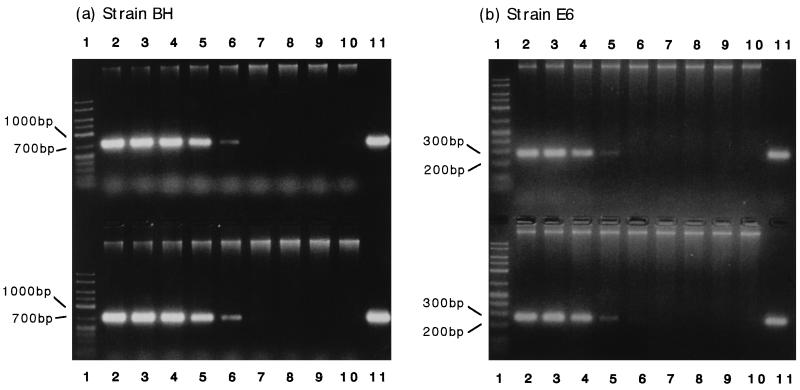
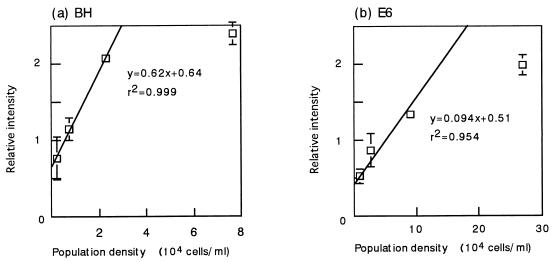
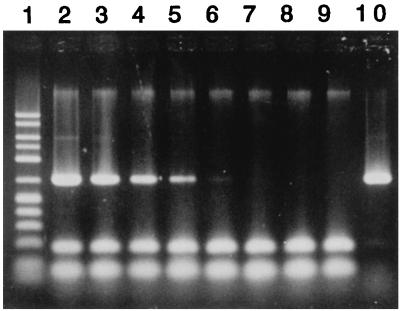
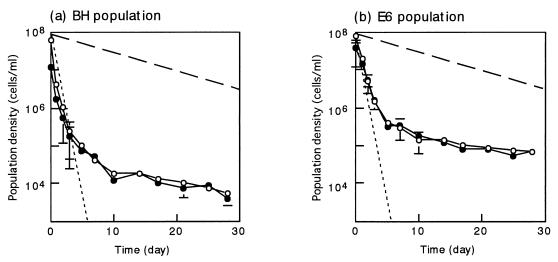
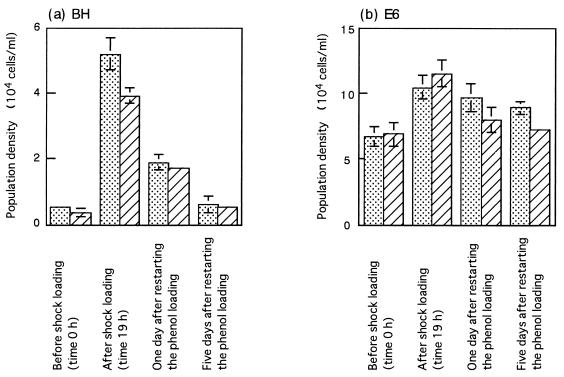
A method for quantifying bacterial populations introduced into an activated-sludge microbial community is described. The method involves extraction of DNA from activated sludge, appropriate dilution of the extracted DNA with DNA extracted from nonintroduced activated sludge, PCR amplification of a gyrB gene fragment from the introduced strain with a set of strain-specific primers, and quantification of the electrophoresed PCR product by densitometry. The adequacy of the method was examined by analyzing the population dynamics of two phenol-degrading bacteria, Pseudomonas putida BH and Comamonas sp. strain E6, that had been introduced into phenol-digesting activated sludge. The density of each of the two populations determined by the PCR method immediately after the introduction was consistent with the density estimated from a plate count of the inoculum. This quantitative PCR method revealed different population dynamics for the two strains in the activated sludge under different phenol-loading conditions. The behavior of both of these strains in the activated sludge reflected the growth kinetics of the strains determined in laboratory axenic cultures.
Figures
Similar articles
-
An outbreak of nonflocculating catabolic populations caused the breakdown of a phenol-digesting activated-sludge process.Appl Environ Microbiol. 1999 Jul;65(7):2813-9. doi: 10.1128/AEM.65.7.2813-2819.1999. Appl Environ Microbiol. 1999. PMID: 10388669 Free PMC article.
-
ERIC-PCR-based strain-specific detection of phenol-degrading bacteria in activated sludge of wastewater treatment systems.Lett Appl Microbiol. 2009 Oct;49(4):522-8. doi: 10.1111/j.1472-765X.2009.02696.x. Epub 2009 Jul 21. Lett Appl Microbiol. 2009. PMID: 19708883
-
Application of reverse transcriptase PCR for monitoring expression of the catabolic dmpN gene in a phenol-degrading sequencing batch reactor.Appl Environ Microbiol. 1995 Nov;61(11):3981-5. doi: 10.1128/aem.61.11.3981-3985.1995. Appl Environ Microbiol. 1995. PMID: 8526513 Free PMC article.
-
Stable augmentation of activated sludge with foreign catabolic genes harboured by an indigenous dominant bacterium.Environ Microbiol. 2002 Oct;4(10):577-83. doi: 10.1046/j.1462-2920.2002.00342.x. Environ Microbiol. 2002. PMID: 12366752
-
Understanding the diversity in catabolic potential of microorganisms for the development of bioremediation strategies.Antonie Van Leeuwenhoek. 2002 Aug;81(1-4):655-63. doi: 10.1023/a:1020534328100. Antonie Van Leeuwenhoek. 2002. PMID: 12448761 Review.
Cited by
-
Influence of sustainability and immigration in assembling bacterial populations of known size and function.Microb Ecol. 2007 Feb;53(2):348-54. doi: 10.1007/s00248-006-9167-0. Microb Ecol. 2007. PMID: 17264996
-
Comparison of methods for quantification of cytochrome cd(1)-denitrifying bacteria in environmental marine samples.Appl Environ Microbiol. 2000 Apr;66(4):1564-71. doi: 10.1128/AEM.66.4.1564-1571.2000. Appl Environ Microbiol. 2000. PMID: 10742243 Free PMC article.
-
Interspecies interactions are an integral determinant of microbial community dynamics.Front Microbiol. 2015 Oct 20;6:1148. doi: 10.3389/fmicb.2015.01148. eCollection 2015. Front Microbiol. 2015. PMID: 26539177 Free PMC article.
-
Computational identification of adaptive mutants using the VERT system.J Biol Eng. 2012 Apr 2;6(1):3. doi: 10.1186/1754-1611-6-3. J Biol Eng. 2012. PMID: 22472487 Free PMC article.
-
Development of amplified fragment length polymorphism-derived functional strain-specific markers to assess the persistence of 10 bacterial strains in soil microcosms.Appl Environ Microbiol. 2010 Nov;76(21):7126-35. doi: 10.1128/AEM.00574-10. Epub 2010 Sep 3. Appl Environ Microbiol. 2010. PMID: 20817796 Free PMC article.
References
-
- Arima K, Komagata K, Minoda S. Metabolism of aromatic compounds. Part 1. Bacterial oxidation of three isomers of monohydroxybenzoic acids. Agric Chem Soc Jpn. 1954;28:629–635.
-
- Assinder S J, Williams P A. The TOL plasmids: determination of the catabolism of toluene and the xylenes. Adv Microb Physiol. 1990;31:1–69. - PubMed
-
- Atlas R M, Bartha R. Microbial ecology: fundamentals and applications. Redwood City, Calif: The Benjamin/Cummings Publishing Company Inc.; 1992. Microbial communities and ecosystems; pp. 130–162.
-
- Blackburn J W, Jain R K, Sayler G S. Molecular microbial ecology of a naphthalene-degrading genotype in activated sludge. Environ Sci Technol. 1987;21:884–890.
Publication types
MeSH terms
Substances
Associated data
- Actions
- Actions
- Actions
- Actions
LinkOut - more resources
Full Text Sources
Other Literature Sources
