. 1998 May 1;18(9):3158-70.
doi: 10.1523/JNEUROSCI.18-09-03158.1998.

Extrasynaptic glutamate diffusion in the hippocampus: ultrastructural constraints, uptake, and receptor activation

Affiliations

Extrasynaptic glutamate diffusion in the hippocampus: ultrastructural constraints, uptake, and receptor activation

D A Rusakov et al. J Neurosci. .

Abstract

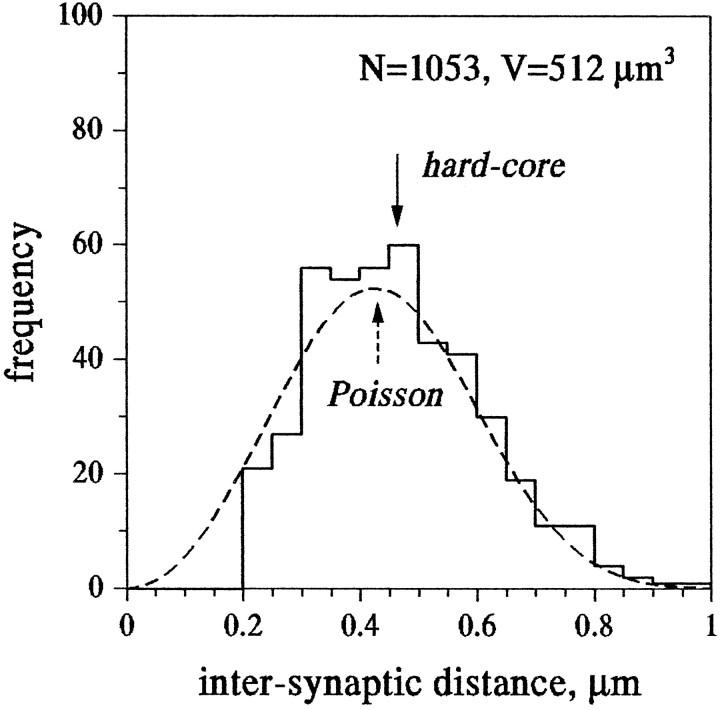
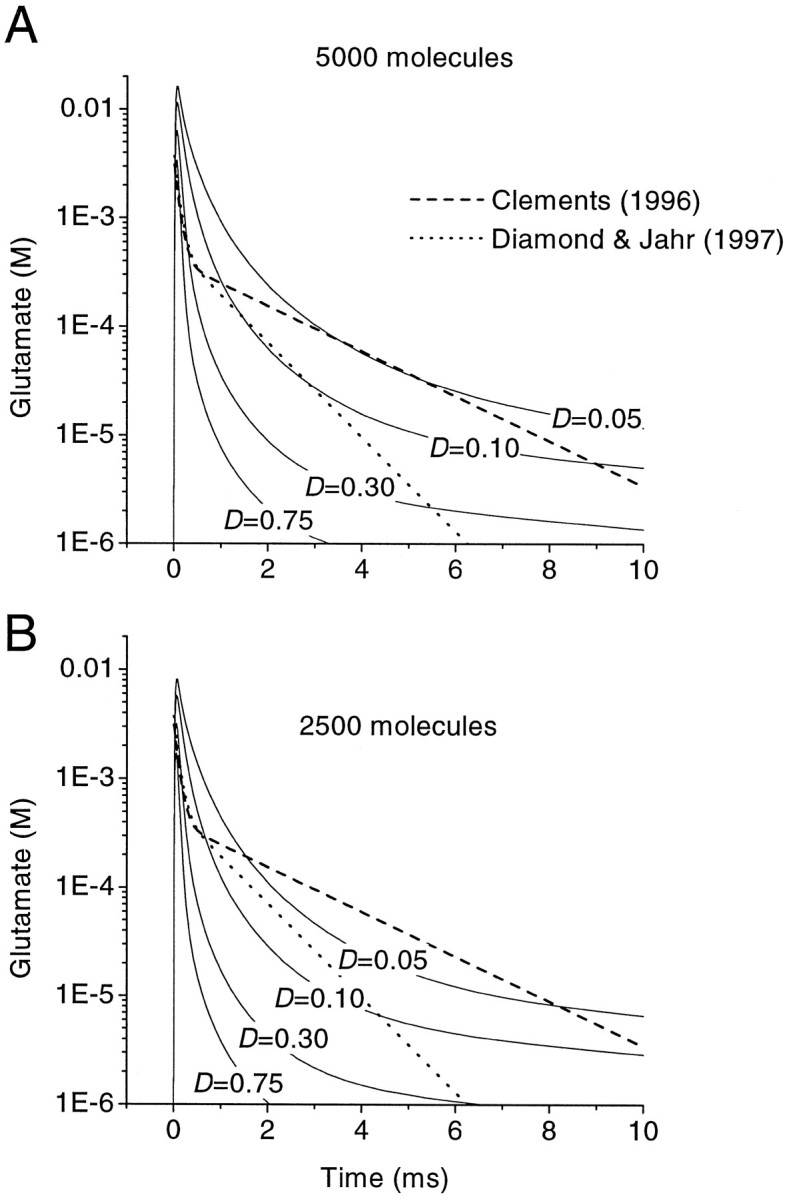
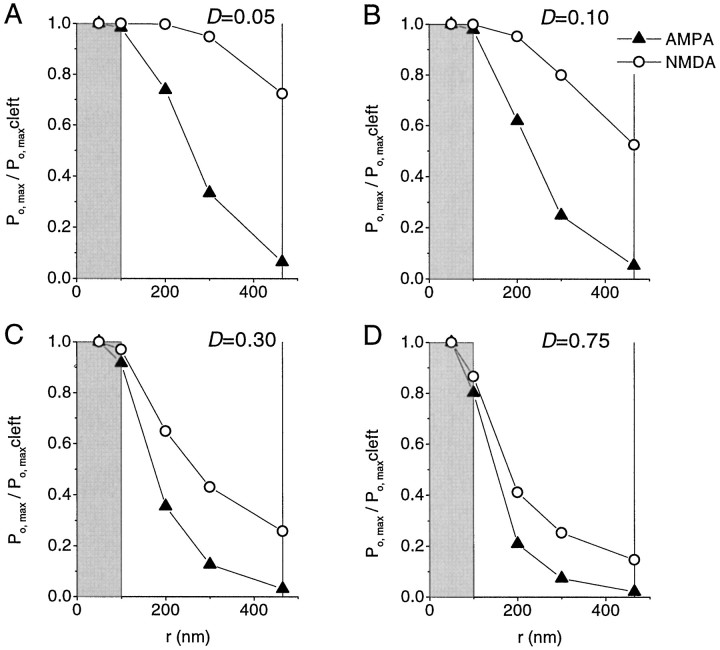
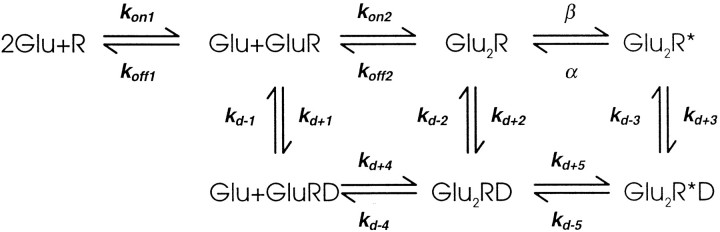
Fast excitatory synapses are generally thought to act as private communication channels between presynaptic and postsynaptic neurons. Some recent findings, however, suggest that glutamate may diffuse out of the synaptic cleft and bind to several subtypes of receptors, either in the perisynaptic membrane or at neighboring synapses. It is not known whether activation of these receptors can occur in response to the release of a single vesicle of glutamate. Here we estimate the spatiotemporal profile of glutamate in the extrasynaptic space after vesicle exocytosis, guided by detailed ultrastructural measurements of the CA1 neuropil in the adult rat. We argue that the vicinity of the synapse can be treated as an isotropic porous medium, in which diffusion is determined by the extracellular volume fraction and the tortuosity factor, and develop novel stereological methods to estimate these parameters. We also estimate the spatial separation between synapses, to ask whether glutamate released at one synapse can activate NMDA and other high-affinity receptors at a neighboring synapse. Kinetic simulations of extrasynaptic glutamate uptake show that transporters rapidly reduce the free concentration of transmitter. Exocytosis of a single vesicle is, however, sufficient to bind to high-affinity receptors situated in the immediate perisynaptic space. The distance separating a typical synapse from its nearest neighbor is approximately 465 nm. Whether glutamate can reach a sufficient concentration to activate NMDA receptors at this distance depends critically on the diffusion coefficient in the extracellular space. If diffusion is much slower than in free aqueous solution, NMDA receptors could mediate crosstalk between neighboring synapses.


Figures

Fig. 1.
Fig. 1.
Morphometric analysis of neuropil. A, Representative picture of the neuropil in area CA1 of rat hippocampus. The sampling frame (2 μm square) is shown in white. pt, Presynaptic terminal;ds, dendritic spine; Ax, axon profile;De, dendritic profile. Scale bar, 400 nm.B, Binary traces of membrane profiles observed inA within the sampling frame. The narrow, vertically orientated rectangular frame represents sampling of surface profile fragments (indicated with dots) according to an infinitesimal approximation illustrated in Figure 2. The angles between each sampled fragment and a horizontal line therefore represent sampled values of Ω or Θ (see Materials and Methods). C, Visible intermembrane distances were measured in electron micrographs as distances between two peaks of gray levels (d in insets) in a direction perpendicular to the cell membranes (whitesegments).
Fig. 2.
Fig. 2.
Geometric assessment of tortuosity. A diffusing particle driven by diffusion gradient ▿C moves along the path dq = AB on surfaceK (with normal vector N) of a diffusion barrier. In free space, however, the particle would be translated by distance dx = AD. An infinitesimally thin (dx thick) slab perpendicular to ▿C intersects a planar fragment of surfaceK (diffusion barrier) giving the relationship between the particle path dq and two angles, Ω and Θ, which determine the orientation of the surface fragment.
Fig. 3.
Fig. 3.
Typical geometry of synaptic microenvironment in CA1. A, Representative picture of the synaptic microenvironment in area CA1 of rat hippocampus. syn1,syn2, Two synaptic profiles of interest. Scale bar, 300 nm. B. Profile of the extracellular space obtained fromA using an image analysis algorithm (see Materials and Methods). Two synaptic active zones (AZ) are marked with short segments. C, Two synaptic profiles depicted inA (syn1, syn2) and B(segments) are centered, aligned, and superimposed (including their mirror images) with respect to the AZ center. The gray levels are reduced proportionately to the number of profiles. D.Superposition of 86 synaptic profiles. The gray level indicates the probability of encountering an extracellular space profile at any point relative to the AZ center.
Fig. 4.
Fig. 4.
Schematic diagram (two-dimensional profile of a three-dimensional model) of the synaptic environment adopted in the simulations. Arrows indicate the diffusion of glutamate (glu) from the cleft into the porous medium. See Materials and Methods for details.
Fig. 5.
Fig. 5.
Morphometric parameters estimated in the neuropil in area CA1. Frequency distribution of angles Ω and Θ, as shown in Fig. 2, sampled as illustrated in Figure 1B.N, Sample size.
Fig. 6.
Fig. 6.
Distribution of distances separating synapses from their nearest neighbors. Dotted line, Unconstrained Poisson process (purely random arrangement); solid histogram, hardcore Poisson process (minimum intersynapse distance = 0.21 μm); arrows indicate the corresponding mean values (see Results). N, Sample size;V, volume used for Monte Carlo simulations.
Fig. 7.
Fig. 7.
Simulated glutamate concentration time course within the synaptic cleft. A, Glutamate concentration profiles after release of 5000 molecules. The concentration of glutamate transporters outside the cleft ([Btot]) was 0.1 mm (see Materials and Methods for other uptake parameters). The solid curves were obtained with different values for the diffusion coefficient in the extracellular space D (in square micrometers per millisecond). The dashed anddotted lines show biexponential glutamate concentration profiles proposed by Clements (1996) and Diamond and Jahr (1997), on the basis of the displacement of rapidly dissociating receptor antagonists in hippocampal cultures. B. Concentration profiles after release of 2500 molecules.
Fig. 8.
Fig. 8.
Effects of varying the concentration of transporters on the spatiotemporal glutamate concentration profiles and opening probability of receptors.A1A3, The curves in each panel show the simulated glutamate concentration time course 50, 100, 200, 300, and 465 nm from the center of the synaptic cleft. Five thousand molecules were released into the center of the cleft, either without transporters (A1) or with an extrasynaptic transporter concentration ([Btot]) of 0.1 mm(A2) or 0.5 mm(A3).B1B3, Opening probability of AMPA receptors positioned at different distances from the release site. C1C3, Opening probability for NMDA receptors, showing a shallower decrease with distance.
Fig. 9.
Fig. 9.
Effect of varying the glutamate diffusion coefficient on the peak opening probability of AMPA and NMDA receptors. The curves in each panel show the Po,maxcalculated at different distances from the release site (synaptic cleft center). Filled triangles, AMPA receptors; open circles, NMDA receptors. The diffusion coefficientD is indicated in each panel (in square micrometers per millisecond). The transporter concentration ([Btot]) was 0.1 mm. Theshaded area represents the synaptic cleft (radius, 100 nm), and the vertical line at 465 nm represents the estimated mean nearest neighbor distance. The ratio ofPo,max at 465 nm toPo,max within the synaptic cleft thus indicates the extent of crosstalk between one typical synapse and its nearest neighbor.
Fig. 10.
Fig. 10.
Dependence of peak opening probability on distance in the presence of background glutamate. The curves in each panel show Po,max, normalized byPo,max in the cleft (50 nm), calculated with a resting glutamate concentration of 0.6 μm. The background Po was first subtracted from the peak response. The diffusion coefficient D is indicated in each panel (in square micrometers per millisecond), and the transporter concentration ([Btot]) was 0.1 mm, as for Figure 9. AMPA receptor-mediated responses show the same steep dependence on distance as with a zero resting glutamate concentration.
None

References

    1. Aramori I, Nakanishi S. Signal transduction and pharmacological characteristics of a metabotropic glutamate receptor, mGluT1, in transfected CHO cells. Neuron. 1992;8:757–765. - PubMed
    1. Asztely F, Erdemli G, Kullmann DM. Extrasynaptic glutamate spillover in the hippocampus: dependence on temperature and the role of active glutamate uptake. Neuron. 1997;18:281–293. - PubMed
    1. Barbour B, Häusser M. Intersynaptic diffusion of neurotransmitter. Trends Neurosci. 1997;20:377–384. - PubMed
    1. Barbour B, Keller BU, Llano I, Marty A. Prolonged presence of glutamate during excitatory synaptic transmission to cerebellar Purkinje cells. Neuron. 1994;12:1331–1343. - PubMed
    1. Baude A, Nusser Z, Roberts JDB, Mulvihill E, Somogyi P. The metabotropic glutamate receptor (mGluR1α) is concentrated at perisynaptic membrane of neuronal subpopulations a detected by immunogold reaction. Neuron. 1993;11:771–787. - PubMed

Publication types

LinkOut - more resources