. 1998 May 1;18(9):3373-85.
doi: 10.1523/JNEUROSCI.18-09-03373.1998.

Microcircuitry and mosaic of a blue-yellow ganglion cell in the primate retina

Affiliations

Microcircuitry and mosaic of a blue-yellow ganglion cell in the primate retina

D J Calkins et al. J Neurosci. .

Abstract

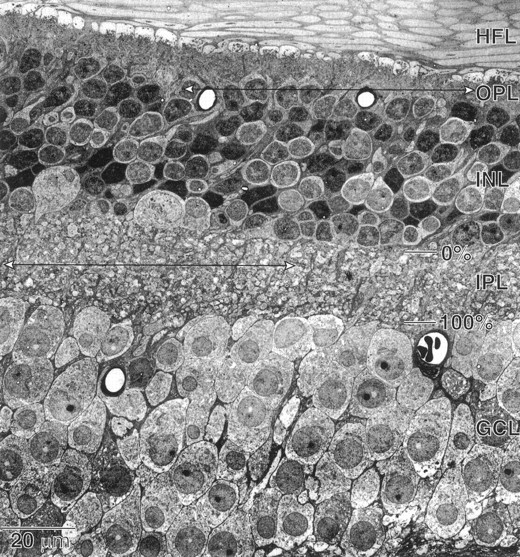
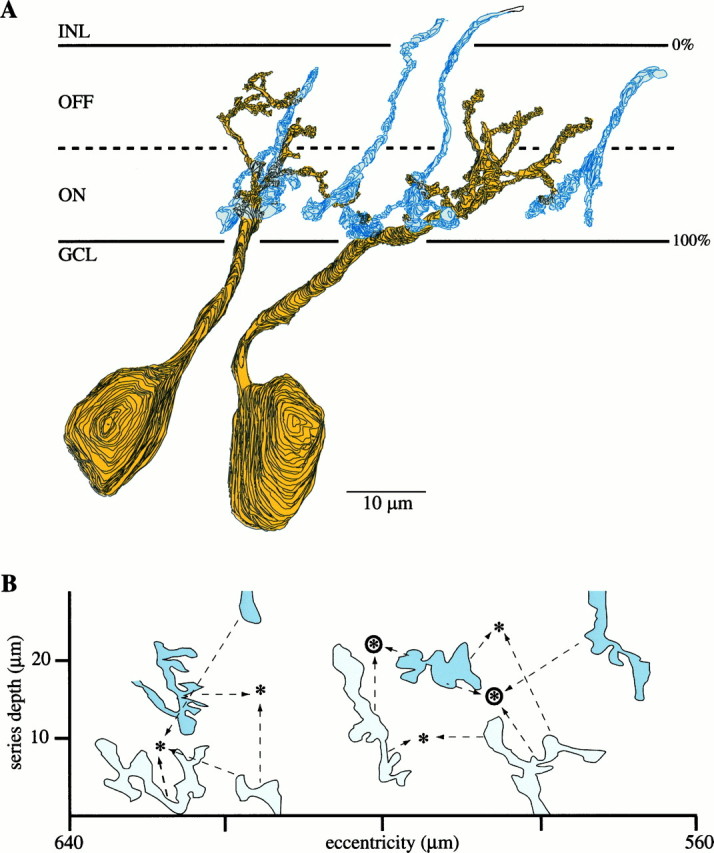
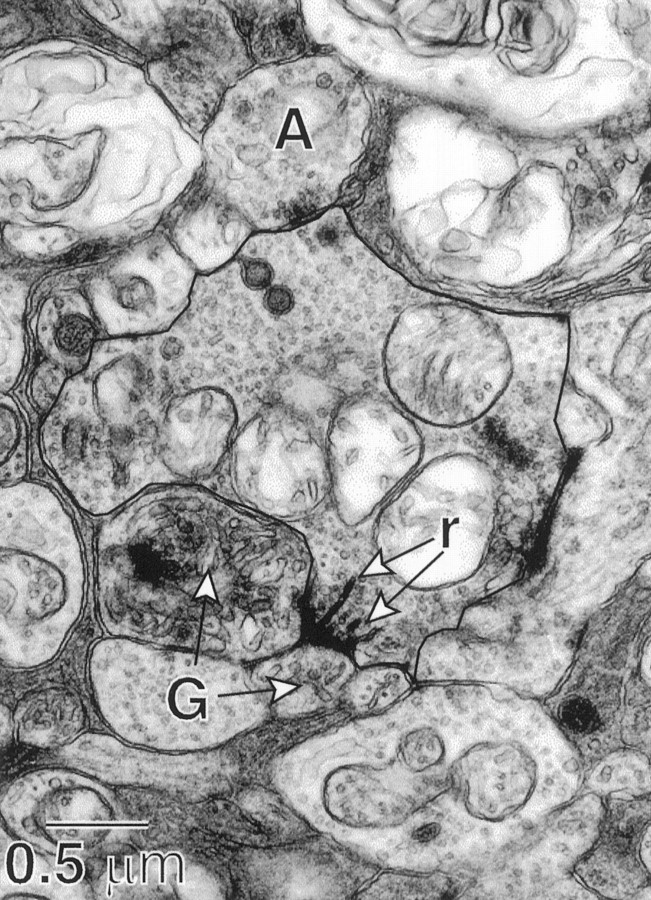
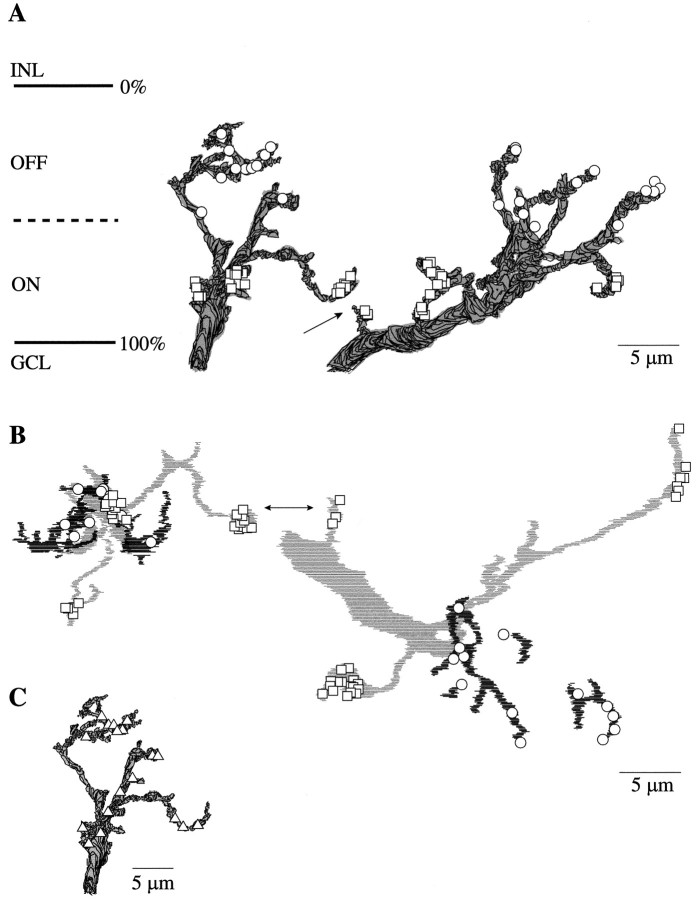
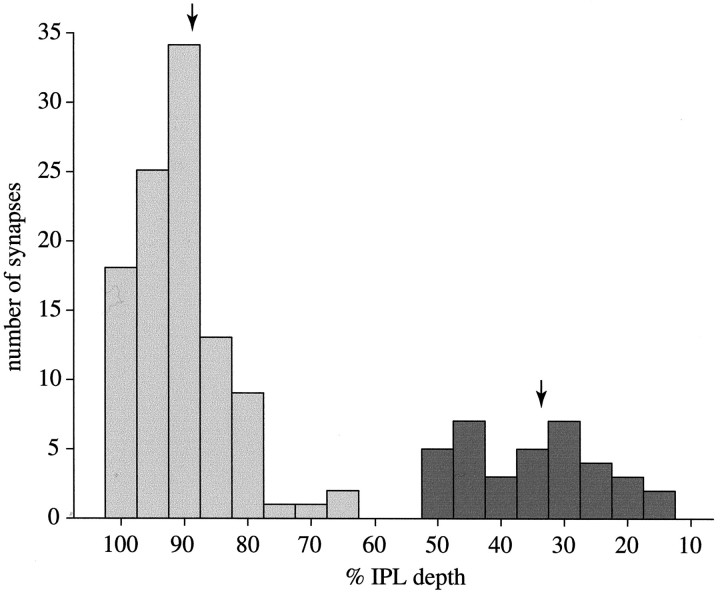
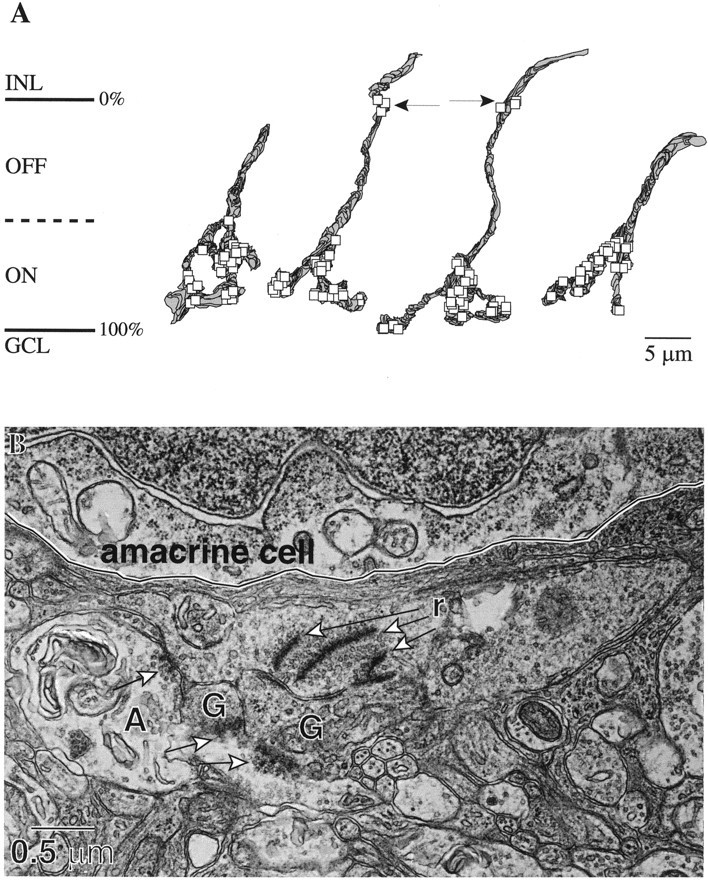
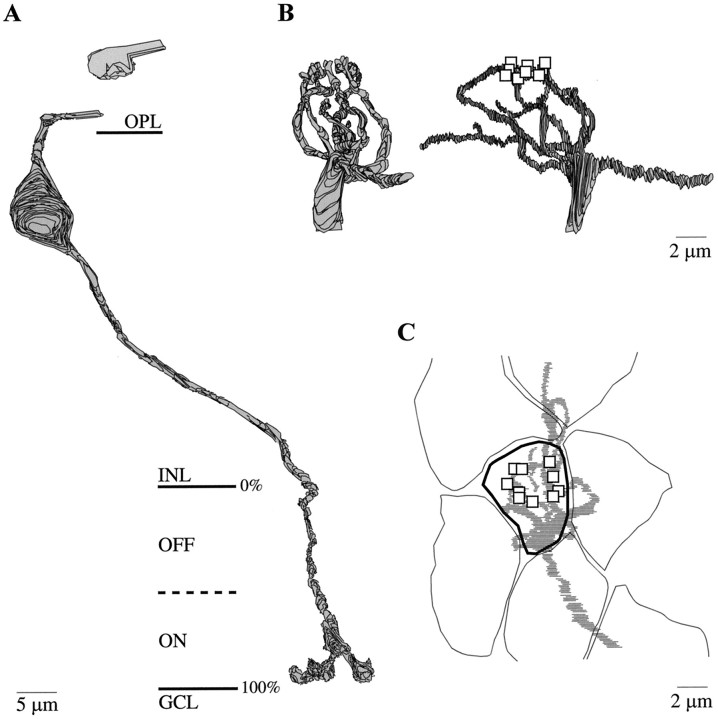
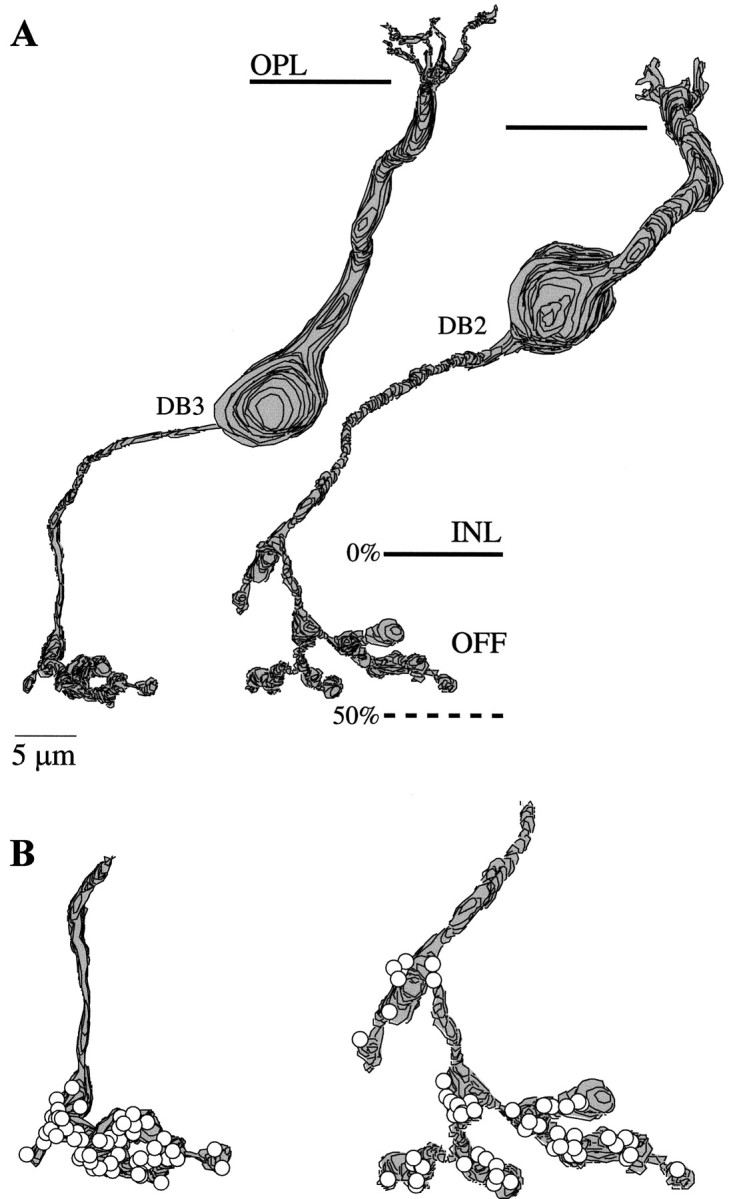
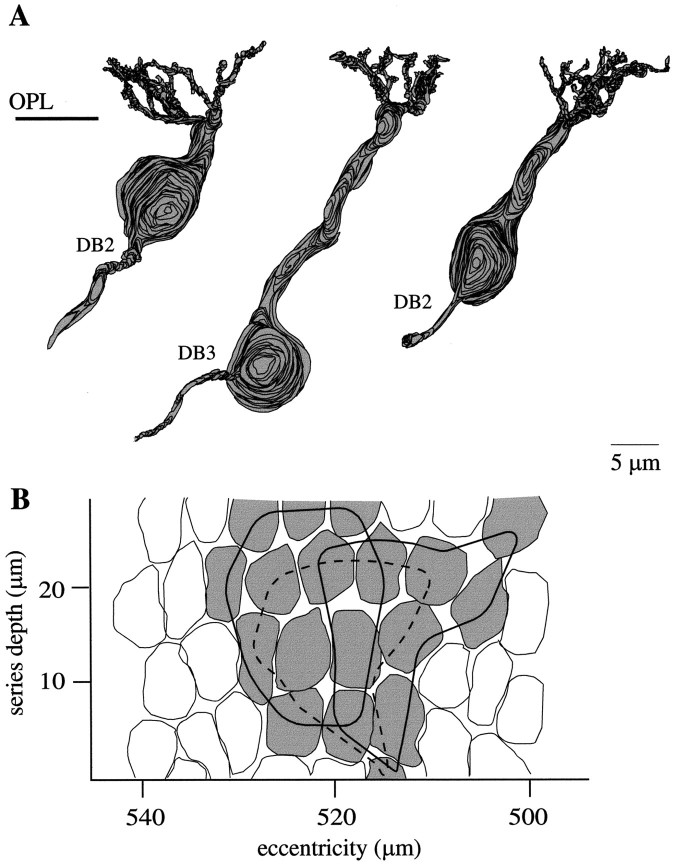
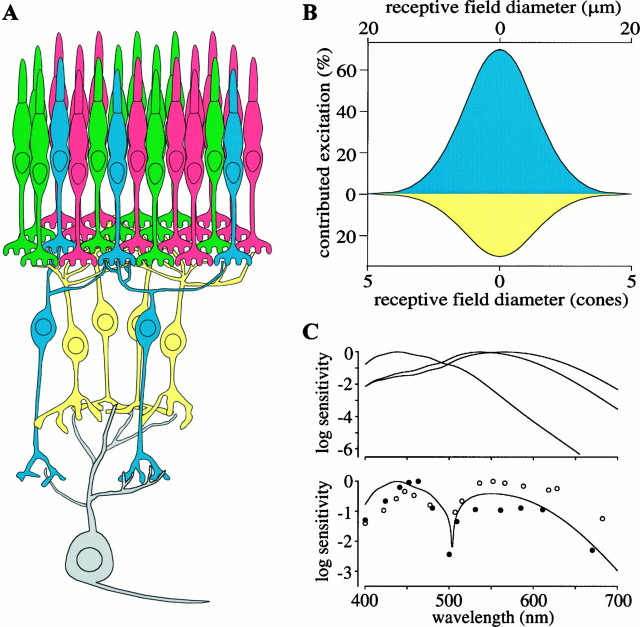
Perception of hue is opponent, involving the antagonistic comparison of signals from different cone types. For blue versus yellow opponency, the antagonism is first evident at a ganglion cell with firing that increases to stimulation of short wavelength-sensitive (S) cones and decreases to stimulation of middle wavelength-sensitive (M) and long wavelength-sensitive (L) cones. This ganglion cell, termed blue-yellow (B-Y), has a distinctive morphology with dendrites in both ON and OFF strata of the inner plexiform layer (Dacey and Lee, 1994). Here we report the synaptic circuitry of the cell and its spatial density. Reconstructing neurons in macaque fovea from electron micrographs of serial sections, we identified six ganglion cells that branch in both strata and have similar circuitry. In the ON stratum each cell collects approximately 33 synapses from bipolar cells traced back exclusively to invaginating contacts from S cones, and in the OFF stratum each cell collects approximately 14 synapses from bipolar cells (types DB2 and DB3) traced to basal synapses from approximately 20 M and L cones. This circuitry predicts that spatially coincident blue-yellow opponency arises at the level of the cone output via expression of different glutamate receptors. S cone stimuli suppress glutamate release onto metabotropic receptors of the S cone bipolar cell dendrite, thereby opening cation channels, whereas M and L cone stimuli suppress glutamate release onto ionotropic glutamate receptors of DB2 and DB3 cell dendrites, thereby closing cation channels. Although the B-Y cell is relatively rare (3% of foveal ganglion cells), its spatial density equals that of the S cone; thus it could support psychophysical discrimination of a blue-yellow grating down to the spatial cutoff of the S cone mosaic.


Figures

Fig. 1.
Fig. 1.
Radial section through macaque fovea (electron micrograph). Top and bottom arrowsindicate the regions studied that connect, respectively, cone terminals to bipolar cell dendrites and bipolar cell axon terminals to ganglion cell dendrites. HFL, Henle fiber layer;OPL, outer plexiform layer; INL, inner nuclear layer; IPL, inner plexiform layer;GCL, ganglion cell layer. The percent depth of the IPL from the INL is indicated. Magnification, 400×.
Fig. 2.
Fig. 2.
B–Y ganglion cells and S cone bipolar cell terminals (reconstructions from electron micrographs).A, B–Y ganglion cells reconstructed from vertical serial sections (yellow). The dendrites branch in both the ON and OFF strata, entwining in the ON stratum with the terminals of S cone bipolar cells (blue). The actual thickness of the IPL varies across the series (see Fig. 1), so the extended lines marking the GCL and INL indicate its maximum thickness.B, ON stratum of IPL in tangential view with outlines of S cone bipolar cell terminals (pale anddark blue) and locations of B–Y ganglion cell dendritic stalks as they penetrate the IPL from the cell body (asterisks). The axon terminals of several S cone bipolar cells converge on each B–Y cell (arrows). Dark blue terminals were traced all the way back to their dendritic tips and contacts from S cones; pale blue terminals could not be traced that far in the IPL but expressed a similar morphology, stratification, number of ribbon synapses, and connectivity. Circled asterisksmark the locations of the ganglion cells shown in A. The scales for A and B are the same.
Fig. 3.
Fig. 3.
S cone bipolar cell terminal outlined withdark line (high-magnification electron micrograph). Ribbon synapses (r) are presynaptic at a dyad to two ganglion cell dendrites (G). The amacrine cell process (A) is presynaptic to the bipolar cell terminal (dark clustering ofvesicles). The bipolar cell is shown reconstructed in Figure 7A.
Fig. 4.
Fig. 4.
Dendritic arbors of B–Y ganglion cells and their synapses (reconstructions from electron micrographs). A,B–Y ganglion cell arbors (radial view) showing synapses from S cone bipolar cells (squares) and diffuse cone bipolar cells (circles). The two cells receive, respectively, 34 and 32 contacts from S cone bipolar cells and 15 and 13 contacts from diffuse bipolar cells, but some contacts are hidden by others. Arrow, Synapses from an S cone bipolar cell that contacts both ganglion cells (Fig. 7A). Because the maximum thickness of the IPL across the series is indicated, the actual depths of the synapses are given in Figure 5. B,Tangential view of the same B–Y ganglion cell dendritic trees.ON stratum, Light shading; OFF stratum, dark shading. C, Twenty-one amacrine cell synapses (triangles) to a B–Y ganglion cell distribute about evenly to dendrites in both ON and OFF strata. These synapses rarely arise from amacrine cell processes postsynaptic to an S cone bipolar cell (see Results).
Fig. 5.
Fig. 5.
Histogram of 103 synapses from S cone bipolar cell terminals (light bars) and 36 synapses from diffuse OFF bipolar cells (dark bars) to the six B–Y ganglion cells in our series as a function of IPL depth. Arrowsindicate means of 88.9 and 33.3%, respectively.
Fig. 6.
Fig. 6.
S cone bipolar cell terminals and axons (reconstructions and an electron micrograph). A, Axon terminals of the four S cone bipolar cells showing locations of their presynaptic ribbons (squares). Two complete terminals on the left contained, respectively, 42 and 39 ribbons; two incomplete terminals on the right contained, respectively, 34 and 36 ribbons. Arrows indicate additional ribbons near the INL border. B, Electron micrograph of an S cone bipolar cell axon first penetrating the IPL. This axon contained seven ribbons (r) in the OFF stratum, three of which are shown pointing to two ganglion cell dendrites (G). The amacrine cell process (A) contacts both the axon and the ganglion cell dendrites (thick arrows).
Fig. 7.
Fig. 7.
Complete S cone bipolar cell and a dendritic tree (reconstructions). A, S cone bipolar cell with dendrites running beneath M and L cone terminals (one shown) to penetrate an S cone terminal (data not shown). The axon contacts the B–Y ganglion cells shown in Figure 2A at the synapses indicated by arrows in Figure4A,B. B, Radial views of another S cone bipolar cell dendritic tree. The dendritic tips form central (invaginating) elements at 10 ribbons (squares) at one S cone terminal, but this number is probably low, because some dendrites under this same cone terminal could not be traced. C,Tangential view of same dendritic arbor shows the primary stalk branching extensively beneath the S cone terminal (thick outline) and two thin branches running beneath M and L terminals toward distant S cone terminals.
Fig. 8.
Fig. 8.
Diffuse bipolar cells and their axon terminals (reconstructions). A, Two types of diffuse bipolar cell are shown. Left, Soma low in the INL and thin axon branching narrowly deep in the OFF stratum; right, soma at middle INL and thicker axon branching diffusely in the OFF stratum. These types correspond morphologically to DB3 and DB2 (Boycott and Wässle, 1991). B, The axon terminals form, respectively, 63 and 53 ribbons (circles).
Fig. 9.
Fig. 9.
Dendritic trees of diffuse bipolar cells (reconstructions). A, Neighboring diffuse OFF bipolar cells: one DB3 and two DB2 cells (radial view). B,Tangential view showing cone terminals that contact the bipolar cells in A. Each dendritic tree (outlined) collects from 10–12 cones with considerable overlap between adjacent arbors. A B–Y ganglion cell collects from three or four diffuse cells; therefore, its OFF receptive field encompasses ∼20 M and L cones.
Fig. 10.
Fig. 10.
Summary of the presynaptic circuitry of the B–Y ganglion cell and its receptive field. A, B–Y ganglion cell collects mostly from one S cone via two or three S cone bipolar cells (blue) and from 20 M and L cones via three or four DB2 and DB3 cells (yellow).B, Estimated receptive field of B–Y ganglion cell contains spatially coextensive regions excited by onset of S cone stimuli (blue) and offset of M and L cone stimuli (yellow). C, Top graph, Spectral sensitivity of S, M, and L cones (Baylor et al., 1987) corrected for absorption by optical media (Wyszecki and Stiles, 1983); S cone spectral sensitivity extrapolated by linear regression for wavelengths >600 nm. Bottom graph, Spectral sensitivity of B–Y cell calculated as the absolute difference between S and M + L. Calculation assumes that M and L cones are present in equal numbers and scales the S and M + L signals according to their numbers of synapses at the ganglion cell. This computed spectral sensitivity matches the spectral sensitivity of two different data sets for B–Y cells (filled and open circles), replotted from Zrenner (1983a,b). In B, theblue onset region represents the receptive field of a single S cone. This was modeled as a Gaussian point spread with a full width at half-height of 2.7 cones, based on a cutoff frequency of 7–14 cycles/degree for optical modulation of short wavelengths (Williams et al., 1993; Marimont and Wandell, 1994) and for S cone-mediated acuity (Stromeyer et al., 1978; Williams et al., 1983; Mullen, 1985; Sekiguchi et al., 1993). Its amplitude was set by the percentage of excitatory synapses contributed to the ganglion cell by S cone bipolar cells (70%). The yellow offset region represents the receptive field of a patch of 20 M and L cones. Each cone receptive field was modeled as a Gaussian point spread with a full width at half-height of 0.49 cones, based on psychophysical measurements of the human optical point spread function (MacLeod et al., 1992). This was convolved with an exponential with a space constant of 1.5 cones for electrical blurring via gap junctions (Hsu and Sterling, 1995). The 20 cones were distributed as in Figure9B and summed with a relative contribution for each of one, 0.67 or 0.33, determined by whether the cone was presynaptic to three, two, or one diffuse OFF bipolar cells. The amplitude of the smoothed sum was set by the percentage of excitatory synapses contributed by diffuse OFF bipolar cells (30%). We assumed a conversion of 220 μm/1° for monkey fovea and a cone spacing at 1° of ∼4 μm (Samy and Hirsch, 1989; Wässle et al., 1990).

References

    1. Atick JJ. Could information theory provide an ecological theory of sensory processing? Network. 1992;3:213–251. - PubMed
    1. Baylor DA, Nunn BJ, Schnapf JL. Spectral sensitivity of cones of the monkey Macaca fascicularis. J Physiol (Lond) 1987;390:145–160. - PMC - PubMed
    1. Boycott BB, Dowling JE. Organization of the primate retina: light microscopy. Philos Trans R Soc Lond B Biol Sci. 1969;255:109–184. - PubMed
    1. Boycott BB, Wässle H. Morphological classification of bipolar cells of the primate retina. Eur J Neurosci. 1991;3:1069–1088. - PubMed
    1. Buchsbaum G, Gottschalk A. Trichromacy, opponent colours coding and optimum colour information transmission in the retina. Proc R Soc Lond B Biol Sci. 1983;220:89–113. - PubMed

Publication types

LinkOut - more resources