. 1998 Apr 20;187(8):1193-204.
doi: 10.1084/jem.187.8.1193.

T helper 1 (Th1) and Th2 characteristics start to develop during T cell priming and are associated with an immediate ability to induce immunoglobulin class switching

Affiliations

T helper 1 (Th1) and Th2 characteristics start to develop during T cell priming and are associated with an immediate ability to induce immunoglobulin class switching

K M Toellner et al. J Exp Med. .

Abstract

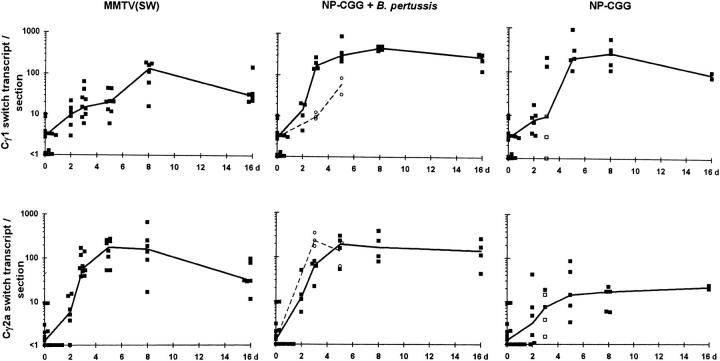
The respective production of specific immunoglobulin (Ig)G2a or IgG1 within 5 d of primary immunization with Swiss type mouse mammary tumor virus [MMTV(SW)] or haptenated protein provides a model for the development of T helper 1 (Th1) and Th2 responses. The antibody-producing cells arise from cognate T cell B cell interaction, revealed by the respective induction of Cgamma2a and Cgamma1 switch transcript production, on the third day after immunization. T cell proliferation and upregulation of mRNA for interferon gamma in response to MMTV(SW) and interleukin 4 in response to haptenated protein also starts during this day. It follows that there is minimal delay in these responses between T cell priming and the onset of cognate interaction between T and B cells leading to class switching and exponential growth. The Th1 or Th2 profile is at least partially established at the time of the first cognate T cell interaction with B cells in the T zone. The addition of killed Bordetella pertussis to the hapten-protein induces nonhapten-specific IgG2a and IgG1 plasma cells, whereas the anti-hapten response continues to be IgG1 dominated. This indicates that a Th2 response to hapten-protein can proceed in a node where there is substantial Th1 activity.


Figures

Figure 5
Figure 5
The number of NP-specific IgM+ and IgG+ cells produced in response to alum-precipitated NP-CGG given with (left) or without B. pertussis. The lines are drawn through the median values at each time point.
Figure 1
Figure 1
Photomicrographs showing the extrafollicular plasma cells in the response to NP-CGG with or without B. pertussis. (A) A typical popliteal lymph node from a nonimmunized, isolator bred, and maintained specific pathogen-free mouse. There are no germinal centers, minimal T zone proliferation, and only occasional plasma cells (arrowed) are seen in the undeveloped medullary cords: F, primary follicles; T, T zone; M, medulla. (B) Section of a mouse popliteal lymph node 8 d after immunization with NP-CGG plus B. pertussis. Well-developed medullary cords are present, which are filled with syndecan+ plasma cells (blue). The red nuclear staining marks cells that have taken up BrdU given in the 2 h before the node was taken: FM, follicular mantle; G, germinal center. (C and D) Sections through medullary cords stained to show NP-binding in blue and IgG2a in gold; (C) from a node 8 d after immunization with NP-CGG only; NP-specific plasma cells are present but no IgG2a+ cells are seen; (D) from a node 8 d after immunization with NP-CGG with B. pertussis; NP-specific cells and non–NP-specific IgG2a+ plasma cells are seen; one IgG2a+ NP-specific cell is stained dark brown (arrowed). Quantitative data corresponding to the cells shown in C and D are given in Table 1. Bars: (A and B) 100 μm; (C and D) 50 μm.
Figure 2
Figure 2
The onset and extent of T cell proliferation in the T zone response to MMTV(SW), alum-precipitated NP-CGG with B. pertussis, and alum-precipitated NP-CGG alone. Number of T cells in the T zone are shown that had taken up BrdU during a 2-h pulse before the lymph node was taken. Each point shown represents the value for one mouse. Three of the five mice immunized with alum-precipitated NP-CGG alone 3 d earlier showed T zone T cell proliferation levels that were at or near background levels. The values for these three mice in this and subsequent figures are shown in open squares (□). Mice were given an i.p. injection of 1 mg BrdU 2 h before the lymph nodes were taken. Cell identification and the counting procedures are described in Materials and Methods. The lines are drawn through the median values at each time point.
Figure 3
Figure 3
The onset and extent of B cell proliferation and plasma cell formation in response to MMTV(SW), alum-precipitated NP-CGG with B. pertussis, and alum-precipitated NP-CGG alone. The upper panels show the number of plasmablasts (syndecan-1+, BrdU+ cells) in the medullary cords. The lower panels show the number of plasma cells (syndecan-1+, BrdU cells) in the medullary cords. Each square shown represents the value for one mouse. Mice were given an i.p. injection of 1 mg BrdU 2 h before the lymph nodes were taken. Cell identification and the counting procedures are described in Materials and Methods. The lines are drawn through the median values at each time point.
Figure 4
Figure 4
The number of IgG1 and IgG2a containing cells in lymph nodes from mice immunized with: MMTV(SW), alum-precipitated NP-CGG with B. pertussis and alum-precipitated NP-CGG alone. The lines are drawn through the median values at each time point. Open circles (○) show the response to B. pertussis alone.
Figure 6
Figure 6
Differential induction of Cγ1 and Cγ2a switch transcript in groups of mice immunized with alum-precipitated NP-CGG with or without B. pertussis or MMTV(SW). Symbols show the amount of switch transcript per lymph node section of individual mice determined by semiquantitative reverse transcriptase–PCR (see Materials and Methods). Three of the five mice immunized with alum-precipitated NP-CGG alone 3 d earlier showed T zone T cell proliferation levels that were at or near background levels, the values for these mice are shown in open squares (□) as in Fig. 2. Open circles (○) show the response to B. pertussis alone. Lines are drawn through the median values at each time point.
Figure 7
Figure 7
Differential induction of IL-4 and IFN-γ mRNA in groups of mice immunized with alum-precipitated NP-CGG with or without B. pertussis or MMTV(SW). Amount of cytokine mRNA per lymph node section determined by semiquantitative reverse transcriptase–PCR. Open squares (□) indicate mice which had not shown T cell proliferation on day 3 (Fig. 2). Open circles (○) show the response to B. pertussis alone. The lines are drawn through the median values at each time point.
Figure 8
Figure 8
The development and size of germinal centers during primary responses to: MMTV(SW), alum-precipitated NP-CGG with B. pertussis, and alum-precipitated NP-CGG alone. Germinal centers were identified in sections triple stained for IgD, CD3, and BrdU. Germinal centers are IgD areas surrounded by IgD+ follicular mantle B cells and contain proliferating BrdU+ cells and only scattered T cells. The lines are drawn through the median values at each time point.

References

    1. Kelso A. Th1 and Th2 subsets: paradigms lost? . Immunol Today. 1995;16:374–379. - PubMed
    1. Abbas AK, Murphy KM, Sher A. Functional diversity of helper T lymphocytes. Nature. 1996;383:787–793. - PubMed
    1. Romagnani S. The Th1/Th2 paradigm. Immunol Today. 1997;18:263–266. - PubMed
    1. Kaufmann SH. Immunity to intracellular bacteria. Annu Rev Immunol. 1993;11:129–163. - PubMed
    1. Mosmann TR, Cherwinski H, Bond MW, Giedlin MA, Coffman RL. 2 types of murine helper T cell clone. I. Definition according to profiles of lymphokine activities and secreted proteins. J Immunol. 1986;136:2348–2357. - PubMed

Publication types

MeSH terms