

Review
doi: 10.1111/j.1469-7793.1998.003bo.x.
Rhythmicity, synchronization and binding in human and primate motor systems
Affiliations
- PMID: 9547376
- PMCID: PMC2230956
- DOI: 10.1111/j.1469-7793.1998.003bo.x
Item in Clipboard
Review
Rhythmicity, synchronization and binding in human and primate motor systems
J Physiol.
.
Abstract
This review focuses on recent advances in our understanding of temporal pattern coding in the motor systems of animals and man. Examples of millisecond time scale rhythmic synchronization in the visual system are considered. Results of experiments that demonstrate similar phenomena in the motor system are discussed. Finally problems concerning the nature of the correlation between neurophysiological signals and the relationship of correlation to motor behaviour are explored.
Figures

A, position of the cortical recording electrodes. A17, area 17; PMLS, posteromedial lateral suprasylvian; LAT, lateral sulcus; SUPS, suprasylvian sulcus; P, posterior; L, lateral. B1-B3, plots of the receptive fields of the PMLS and area 17 cell. The circle represents the visual centre. The bars represent the stimulus conditions used. B1, the stimulus is a single moving bar. B2, the stimuli are two bars moving at the same rate in the same direction. B3, the stimuli are two bars moving at the same rate in opposite directions. C1-C3, post-stimulus time histograms (PSTHs) for multiunit PMLS and area 17 recordings for each of the three stimulus conditions. The vertical lines indicate the 1 s time window from which the autocorrelograms (D) and cross-correlograms (E) were constructed. D1-D3, comparison of the autocorrelograms for the two visual areas in each of the three conditions. E1-E3, cross-correlograms constructed between the area 17 and PMLS discharges for each of the three stimulus conditions. The mean level of the auto- and cross-correlograms changes little as a result of change in stimulus condition, indicating that there is little alteration in firing rate of the neurones. The peak at time zero indicates that the responses are synchronized when the stimuli are moving in the same direction (E1 and E2). The synchronization between area 17 and PMLS is absent when the stimuli are moving in opposite directions (E3). The presence of side bands in E1 and E2 indicates that the synchronization is oscillatory, with a period of ∼25 ms (∼40 Hz). (Reproduced with permission from Engel et al. 1991.)

Upper traces: LFPs recorded simultaneously in five anterior-posterior tracks each separated by 2 mm. Lower left: electrode sites, marked on a sketch of the cortical surface, straddled the central sulcus. Lower right: averages of LFPs aligned on triggers from oscillatory cycles in LFP 1. Note that LFPs 1-5 are rhythmic and occur synchronously. The monkey was reaching for a raisin offered to the side of its head by the experimenter. Vertical calibration bars are in μV, horizontal calibration bars are in ms. (Reproduced with permission from Murthy & Fetz, 1992.)
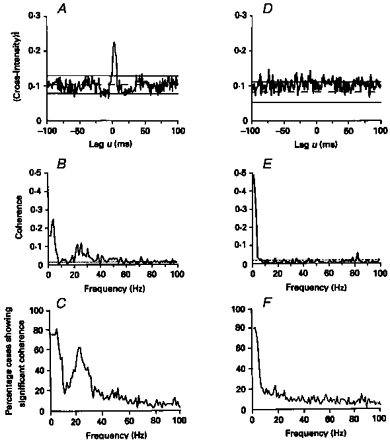
A, cross-correlogram constructed between the discharges of two single motor units from first dorsal interosseus muscle (1DI) in a healthy subject. B, coherence spectra for the data used to construct the cross-correlogram in A. D, cross-correlogram constructed between the discharges of two motor units recorded from within 1DI of the affected (left) hand in a patient who had suffered an infarct of the right internal capsule 4 months previously. E, coherence spectra for the data used to construct the cross-correlogram in D. The central cross-correlogram peak is absent in the data recorded from the stroke patient; the corresponding coherence is significant only at low frequencies. Bin width in A and D, 1 ms; frequency resolution in B and E, 1 Hz. C and F, the percentage of 1DI motor unit pairs that showed significant coherence between 1 and 100 Hz. C, data from 1DI of sixteen healthy subjects (49 motor unit pairs); F, data from 1DI of eleven stroke patients (91 motor unit pairs). (Reproduced from Farmer et al. 1993a.)

A, estimated autospectrum of MEG recorded from above the left sensorimotor cortex during simultaneous isometric abduction of left and right index fingers. B, estimated autospectrum of surface EMG recorded from left 1DI. C, estimated autospectrum of surface EMG recorded from right 1DI. D, coherence between left cortex MEG and left 1DI EMG. E, coherence between left cortex MEG and right 1DI EMG. F, cumulant density (time domain) function between left cortex MEG and left 1DI EMG. G, cumulant density function between left cortex MEG and right 1DI EMG. The vertical bars next to the autospectra represent 95 % confidence intervals. The horizontal dotted lines represent 95 % confidence intervals for the coherence. The dotted line and parallel continuous lines represent the mean and ±95 % confidence intervals for the cumulants. Coherence in the frequency range 18-25 Hz is present between the MEG and contralateral EMG only. The corresponding time domain measure demonstrates rhythmic synchronization between MEG and EMG. (Reproduced from Conway et al. 1995.)

A-C relate to first dorsal interosseous muscle (1DI); D-F relate to adductor pollici muscle (AdP). The bars at the top of the two columns indicate the range over which the amplifiers had a flat frequency response. A and D, EMG power spectra. A small ∼20 Hz peak is present in D. B and E, coherence between cortical slow wave and simultaneously recorded EMG from 1DI and AdP, respectively. C and F, coherence between cortical slow wave recording from a different cortical site and simultaneously recorded 1DI and AdP EMGs. Large values of coherence at 0 Hz (DC) have been removed. The insets in B-F represent cross-correlations between the slow wave and the EMG; the arrow indicates time zero. Scale bars are 20 ms, r= 0.01. G, coherence between simultaneously recorded EMGs from 1DI and AdP during a steady pincer grip. Coherence at ∼20 Hz is present between the cortical slow wave and EMGs from 1DI and AdP. Due to electrical cross-talk coherence is present between 1DI and AdP EMGs at all frequencies. However, a large peak is present at ∼20 Hz, the same frequency at which coherence is observed between the cortical slow wave and EMG. Compare, in this paper, Fig. 5G with Fig. 3B-C and Fig. 5B-F with Fig. 4E and G. (Reproduced from Baker et al. 1997.)
References
-
- Bouyer JJ, Montaron MF, Vahnee JM, Albert MP, Rougeul A. Anatomical localization of cortical beta rhythms in cat. Neuroscience. 1987;22:863–869. - PubMed
-
- Bullock TH, Achimowicz JZ. A comparative study of event-related brain oscillations. In: Pantev C, Elbert T, Lutkenhoner B, editors. Oscillatory Event-related Brain Dynamics. New York: Plenum Press; 1994. pp. 11–26.
-
- Cheney PD, Fetz EE. Comparable patterns of muscle facilitation evoked by individual corticomotoneuronal (CM) cells and by single intracortical microstimulation in primate. Evidence for functional groups of CM cells. Journal of Neurophysiology. 1985;53:786–804. - PubMed
-
- Conway BA, Biswas P, Halliday DM, Farmer SF, Rosenberg JR. Task-dependent changes in rhythmic motor output during voluntary elbow movement in man. Journal of Physiology. 1997;501.P:48–49P.
Publication types
MeSH terms
LinkOut - more resources
Full Text Sources