. 1998 Apr 20;141(2):431-41.
doi: 10.1083/jcb.141.2.431.

Defect in synaptic vesicle precursor transport and neuronal cell death in KIF1A motor protein-deficient mice

Affiliations

Defect in synaptic vesicle precursor transport and neuronal cell death in KIF1A motor protein-deficient mice

Y Yonekawa et al. J Cell Biol. .

Abstract

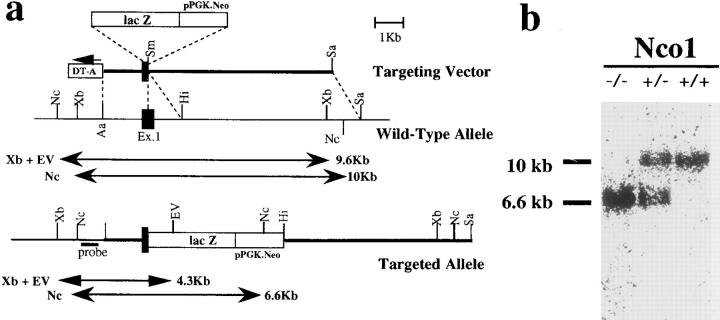
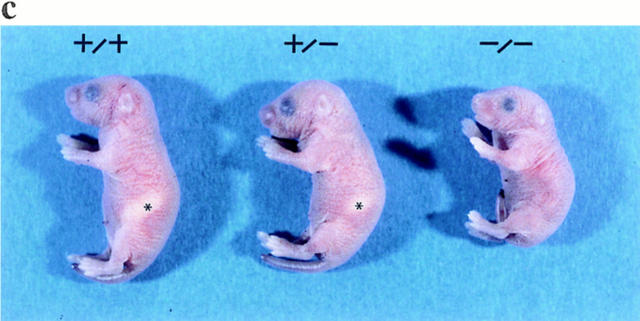
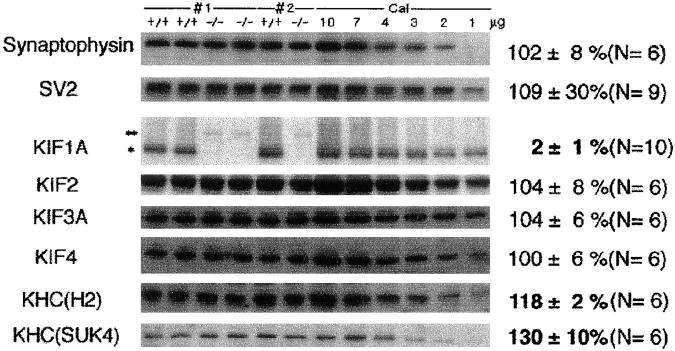
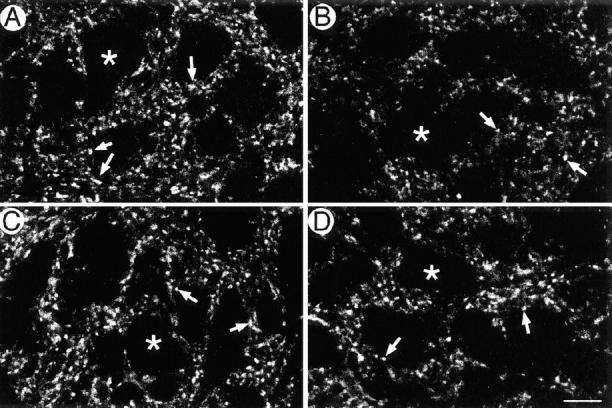
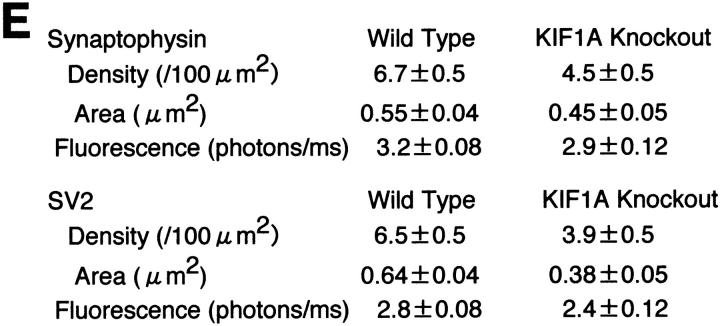
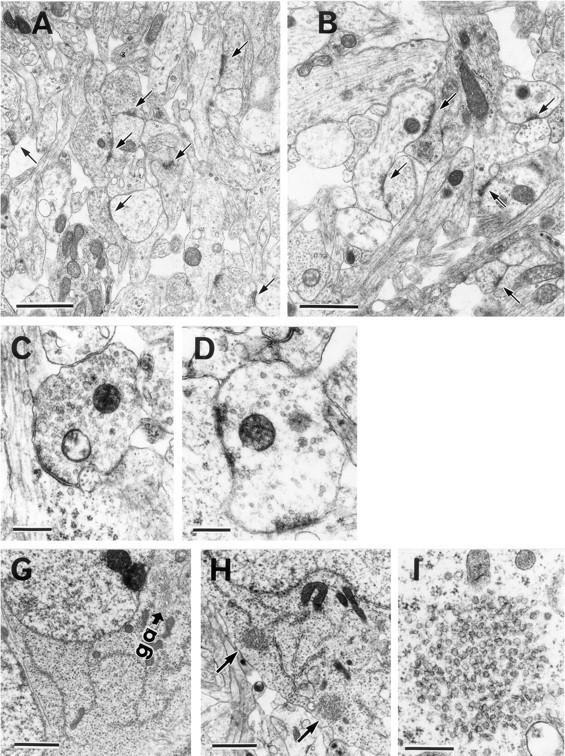
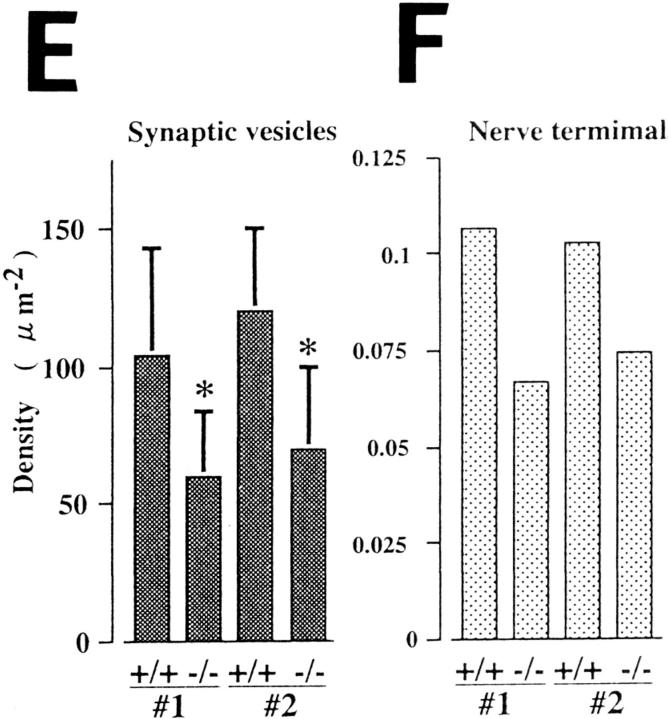
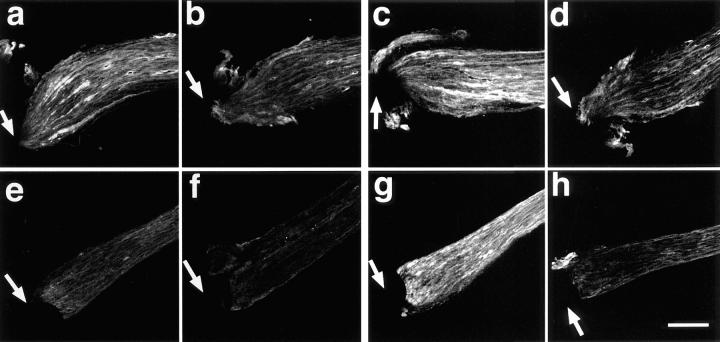
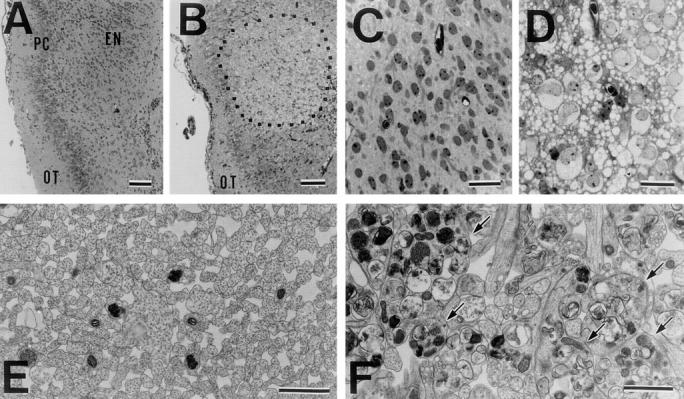
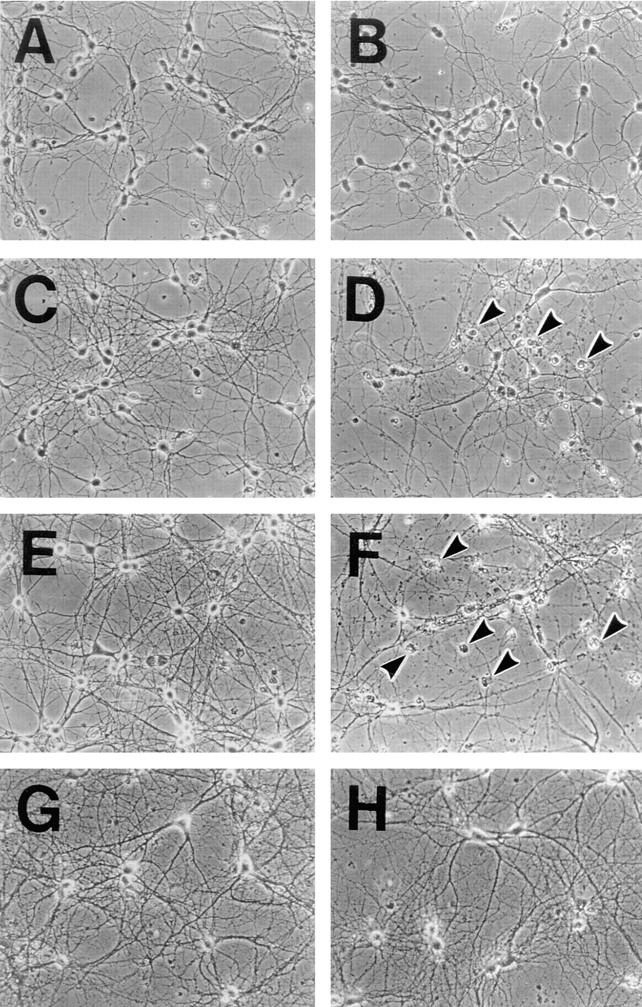
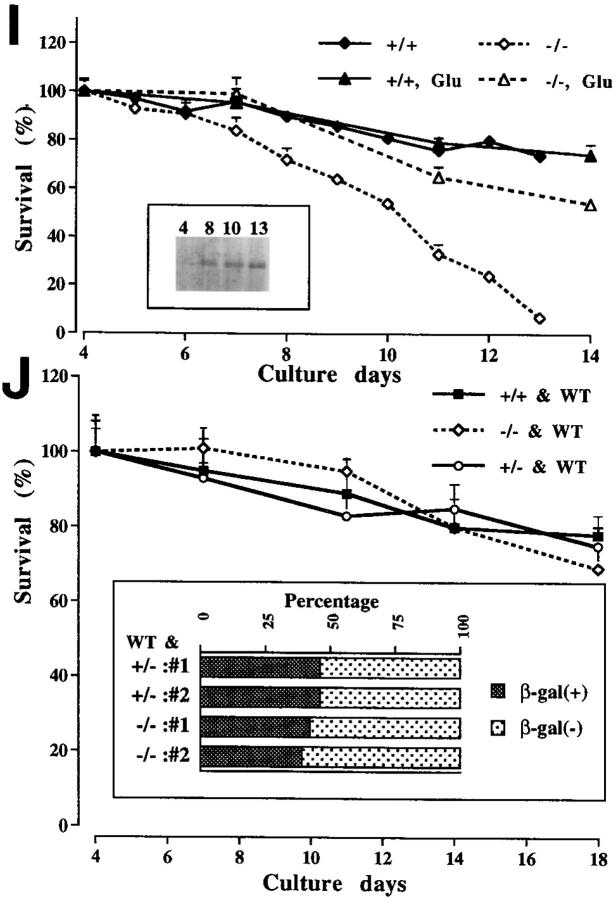
The nerve axon is a good model system for studying the molecular mechanism of organelle transport in cells. Recently, the new kinesin superfamily proteins (KIFs) have been identified as candidate motor proteins involved in organelle transport. Among them KIF1A, a murine homologue of unc-104 gene of Caenorhabditis elegans, is a unique monomeric neuron- specific microtubule plus end-directed motor and has been proposed as a transporter of synaptic vesicle precursors (Okada, Y., H. Yamazaki, Y. Sekine-Aizawa, and N. Hirokawa. 1995. Cell. 81:769-780). To elucidate the function of KIF1A in vivo, we disrupted the KIF1A gene in mice. KIF1A mutants died mostly within a day after birth showing motor and sensory disturbances. In the nervous systems of these mutants, the transport of synaptic vesicle precursors showed a specific and significant decrease. Consequently, synaptic vesicle density decreased dramatically, and clusters of clear small vesicles accumulated in the cell bodies. Furthermore, marked neuronal degeneration and death occurred both in KIF1A mutant mice and in cultures of mutant neurons. The neuronal death in cultures was blocked by coculture with wild-type neurons or exposure to a low concentration of glutamate. These results in cultures suggested that the mutant neurons might not sufficiently receive afferent stimulation, such as neuronal contacts or neurotransmission, resulting in cell death. Thus, our results demonstrate that KIF1A transports a synaptic vesicle precursor and that KIF1A-mediated axonal transport plays a critical role in viability, maintenance, and function of neurons, particularly mature neurons.


Figures

Figure 1
Figure 1
Targeted disruption of the KIF1A gene. (a) Schematic representation of the targeting event. The diagrams depict the structure of the targeting vector (top), the KIF1A wild-type allele containing the first coding exon (middle), and the targeted allele (bottom). Restriction enzymes Xb, XbaI; Nc, NcoI; Hi, HindIII; Sm, SmaI; Sa, SalI; EV, EcoRV. A neomycin resistance gene driven by the pgk promoter (pPGK.Neo) and a diphtheria toxin A fragment gene controlled by the MC1 promoter (DT-A) were used as positive and negative selection markers in the targeting vector, respectively. The first coding exon (Ex. 1) is represented as a closed box. The lac Z sequence was fused in-frame with the first 51 nucleotides of the KIF1A gene to express functional β-galactosidase under the control of the KIF1A promoter. The 5′ genomic probe external to the targeting construct hybridized to a 9.6-kb XbaI/EcoRV fragment or a 10-kb NcoI fragment from the wild-type allele and to a 4.3-kb XbaI/EcoRV fragment or a 6.6-kb NcoI fragment from the targeted allele. (b) Southern blot analysis of tail DNA from homozygous (−/−), heterozygous (+/−), and wild-type (+/+) mice. Genomic DNA isolated from the newborn pups was digested with NcoI and hybridized with the 5′ probe. (c) Gross appearance of wild-type, heterozygous, and homozygous mice 1 d after birth. The homozygous mice were smaller than their wild-type and heterozygous littermates and failed to feed, leading to a lack of milk in their stomachs. Stomachs filled with milk in wild-type and heterozygous mice are marked with asterisks.
Figure 1
Figure 1
Targeted disruption of the KIF1A gene. (a) Schematic representation of the targeting event. The diagrams depict the structure of the targeting vector (top), the KIF1A wild-type allele containing the first coding exon (middle), and the targeted allele (bottom). Restriction enzymes Xb, XbaI; Nc, NcoI; Hi, HindIII; Sm, SmaI; Sa, SalI; EV, EcoRV. A neomycin resistance gene driven by the pgk promoter (pPGK.Neo) and a diphtheria toxin A fragment gene controlled by the MC1 promoter (DT-A) were used as positive and negative selection markers in the targeting vector, respectively. The first coding exon (Ex. 1) is represented as a closed box. The lac Z sequence was fused in-frame with the first 51 nucleotides of the KIF1A gene to express functional β-galactosidase under the control of the KIF1A promoter. The 5′ genomic probe external to the targeting construct hybridized to a 9.6-kb XbaI/EcoRV fragment or a 10-kb NcoI fragment from the wild-type allele and to a 4.3-kb XbaI/EcoRV fragment or a 6.6-kb NcoI fragment from the targeted allele. (b) Southern blot analysis of tail DNA from homozygous (−/−), heterozygous (+/−), and wild-type (+/+) mice. Genomic DNA isolated from the newborn pups was digested with NcoI and hybridized with the 5′ probe. (c) Gross appearance of wild-type, heterozygous, and homozygous mice 1 d after birth. The homozygous mice were smaller than their wild-type and heterozygous littermates and failed to feed, leading to a lack of milk in their stomachs. Stomachs filled with milk in wild-type and heterozygous mice are marked with asterisks.
Figure 2
Figure 2
Quantitative immunoblot analysis. Three pairs of mice from two litters are shown here; #1 and #2, litter numbers. To the left of these lanes, calibration standards are shown. 10 to 1 μg of crude brain extract from a wild-type mouse was used as the standard. In the lane containing crude brain extract from homozygous mutants, a faint band corresponding to a molecular mass of 320 kD (**) was detected. The intensity of the signal was about 1% of that for the band of 200-kD KIF1A (*) from the brains of wild-type mice. This band was also detected with an anti–lac Z antibody (data not shown), suggesting that the band is a lac Z–KIF1A fusion protein. The concentrations of synaptic vesicle proteins (Synaptophysin and SV2) and most brain KIFs (KIF2, KIF3, KIF4) remained unchanged, while the KHC concentration was increased in the brains of the homozygous mutants.
Figure 3
Figure 3
Immunohistochemical analysis of spinal anterior horn regions. (A–D) Semiquantitative direct immunofluorescence analysis of the localization of synaptic vesicle proteins in the spinal cord of wild-type mice (A and C) and homozygous mutants (B and D). High-magnification views of anterior horn of the T7 spinal cord stained with Cy5-labeled antisynaptophysin antibody (A and B) and Cy3.5-labeled anti-SV2 antibody (C and D). Some neuronal cell bodies are indicated with an asterisk, and some synaptic terminals are indicated with arrows. (E) Summary of the results of the quantitative analysis. Density, the density of the fluorescently labeled spots. Area, the mean area of the spots. Fluorescence, the upper tenth percentile value of the fluorescence intensity. Each value is shown in the format of mean ± SEM (n = 36 for wild-type mice, and 25 for mutant mice). Bar, 10 μm.
Figure 3
Figure 3
Immunohistochemical analysis of spinal anterior horn regions. (A–D) Semiquantitative direct immunofluorescence analysis of the localization of synaptic vesicle proteins in the spinal cord of wild-type mice (A and C) and homozygous mutants (B and D). High-magnification views of anterior horn of the T7 spinal cord stained with Cy5-labeled antisynaptophysin antibody (A and B) and Cy3.5-labeled anti-SV2 antibody (C and D). Some neuronal cell bodies are indicated with an asterisk, and some synaptic terminals are indicated with arrows. (E) Summary of the results of the quantitative analysis. Density, the density of the fluorescently labeled spots. Area, the mean area of the spots. Fluorescence, the upper tenth percentile value of the fluorescence intensity. Each value is shown in the format of mean ± SEM (n = 36 for wild-type mice, and 25 for mutant mice). Bar, 10 μm.
Figure 4
Figure 4
Electron microscopic analysis of spinal anterior horn regions. (A and B) Electron micrographs of cross sections of the anterior horn regions of the spinal cords (thoracic level 7, T7) of wild-type (A) and homozygous mutant (B) mice. The densities of nerve terminals and synaptic vesicles were decreased in the mutant mice. Arrows indicate nerve terminals. (C and D) Nerve terminals of wild-type (C) and homozygous mutant (D) mice. (E and F) Morphometric analysis of densities of synaptic vesicles (E) and nerve terminals (F) from two independent litters (#1, #2). Bar heights represent the mean ± SD (E) or the mean (F). T test comparisons of the density of synaptic vesicles between the wild-type and mutant mice reveal a statistically significant decrease in the density (*P < 0.00001) (E). (G and H) Neuronal cell bodies in the wild-type (G) and mutant mice (H). Neuronal cell bodies containing clusters of small vesicles were observed in the mutant mice (H) but not in the wild-type mice (G). Arrows, clusters of small vesicles (H). (I) A higher-magnification view of one of these clusters. ga, the Golgi apparatus. Bars: (A and B) 1.4 μm; (C and D) 400 nm; (G and H) 2 μm ; (I) 400 nm.
Figure 4
Figure 4
Electron microscopic analysis of spinal anterior horn regions. (A and B) Electron micrographs of cross sections of the anterior horn regions of the spinal cords (thoracic level 7, T7) of wild-type (A) and homozygous mutant (B) mice. The densities of nerve terminals and synaptic vesicles were decreased in the mutant mice. Arrows indicate nerve terminals. (C and D) Nerve terminals of wild-type (C) and homozygous mutant (D) mice. (E and F) Morphometric analysis of densities of synaptic vesicles (E) and nerve terminals (F) from two independent litters (#1, #2). Bar heights represent the mean ± SD (E) or the mean (F). T test comparisons of the density of synaptic vesicles between the wild-type and mutant mice reveal a statistically significant decrease in the density (*P < 0.00001) (E). (G and H) Neuronal cell bodies in the wild-type (G) and mutant mice (H). Neuronal cell bodies containing clusters of small vesicles were observed in the mutant mice (H) but not in the wild-type mice (G). Arrows, clusters of small vesicles (H). (I) A higher-magnification view of one of these clusters. ga, the Golgi apparatus. Bars: (A and B) 1.4 μm; (C and D) 400 nm; (G and H) 2 μm ; (I) 400 nm.
Figure 5
Figure 5
Sciatic nerve ligation experiment. Sciatic nerves of wild-type (a–d) and KIF1A knockout (e–h) littermate mice were ligated for 3 h and then stained with antisynaptotagmin (a and e) or with anti–syntaxin 1A (c and g). Both synaptotagmin and syntaxin accumulate significantly in the proximal regions of the ligated site (arrows) in wild-type mice (a and c). In mutant mice, synaptotagmin does not accumulate significantly (e), while syntaxin shows significant accumulation (g). b, d, f, and h show the negative control with nonspecific mouse IgG. Sections shown in a–d and e–h are from same nerves, respectively. Bar, 100 μm.
Figure 6
Figure 6
Neuropathological analysis. (A–D) Toluidine blue–stained cross sections of rhinencephalon areas of wild-type (A and C) and homozygous mutant mice (B and D). The focal lesion (dotted region) in the piriform cortex and endopiriform nucleus shows severe degeneration of neuronal cells and a large number of vacuoles surrounding the degenerative cells in the mutant mice. A higher-magnification view of the degenerative lesion (D). OT, lateral olfactory tract; PC, piriform cortex; EN, endopiriform nucleus. (E and F) Electron micrographs of cross sections of the fimbrias of hippocampi of wild-type (E) and mutant (F) mice. Massive degeneration of many axons (arrows) occurred in the mutant mice. The axons are very dilated and filled with membranous organelles. Bars: (A and B) 100 μm ; (C and D) 25 μm; (E and F) 1 μm.
Figure 7
Figure 7
Analysis of cultured hippocampal neurons. (A–H) Phase contrast views of cultured hippocampal neurons from wild-type (A, C, E, and G) and homozygous mutant (B, D, F, and H) mice at 4 (A and B), 8 (C and D), 13 (E and F), and 18 d (G and H) in culture. Arrowheads indicate dying cells (D and F). Cultured neurons exposed to a low concentration of glutamate (15 μM) (G and H). (I) Survival curve for cultured hippocampal neurons from the wild-type (+/+) and mutant (−/−) mice. The exposure of the mutant cells to the low concentration of glutamate greatly promoted their survival (+/+Glu, −/−Glu). Each point represents the mean ± SD percentage of the cell numbers compared with that for each culture at D4. Inset shows the results of immunoblot analysis for determination of the level of KIF1A expression in the wild-type neurons at D4, 8, 10, and 13. (J) Coculture with wild-type cells prevented the mutant cells from dying. Equal numbers of the mutant and wild-type cells (prepared from embryos of wild-type BALB/c mice) were cocultured. Each point represents the mean ± SD percentage of the total cell numbers. WT, wild-type neurons derived from BALB/c mice. Inset shows the percentage of mutant cells at D18. To distinguish mutant cells from wild-type cells, we performed X-gal staining. We counted ∼2,000 β-gal–positive (homozygous or heterozygous mutant) cells and β-gal–negative (wild-type) cells. #1 and #2, litter numbers. Note that the numbers of homozygous cells and wild-type cells were almost equal.
Figure 7
Figure 7
Analysis of cultured hippocampal neurons. (A–H) Phase contrast views of cultured hippocampal neurons from wild-type (A, C, E, and G) and homozygous mutant (B, D, F, and H) mice at 4 (A and B), 8 (C and D), 13 (E and F), and 18 d (G and H) in culture. Arrowheads indicate dying cells (D and F). Cultured neurons exposed to a low concentration of glutamate (15 μM) (G and H). (I) Survival curve for cultured hippocampal neurons from the wild-type (+/+) and mutant (−/−) mice. The exposure of the mutant cells to the low concentration of glutamate greatly promoted their survival (+/+Glu, −/−Glu). Each point represents the mean ± SD percentage of the cell numbers compared with that for each culture at D4. Inset shows the results of immunoblot analysis for determination of the level of KIF1A expression in the wild-type neurons at D4, 8, 10, and 13. (J) Coculture with wild-type cells prevented the mutant cells from dying. Equal numbers of the mutant and wild-type cells (prepared from embryos of wild-type BALB/c mice) were cocultured. Each point represents the mean ± SD percentage of the total cell numbers. WT, wild-type neurons derived from BALB/c mice. Inset shows the percentage of mutant cells at D18. To distinguish mutant cells from wild-type cells, we performed X-gal staining. We counted ∼2,000 β-gal–positive (homozygous or heterozygous mutant) cells and β-gal–negative (wild-type) cells. #1 and #2, litter numbers. Note that the numbers of homozygous cells and wild-type cells were almost equal.

Similar articles

Cited by

References

    1. Adams, J.H., and L.W. Duchen. 1992. Greenfield's Neuropathology. Edward Arnold, London. 1,557 pp.
    1. Aizawa H, Sekine Y, Takemura R, Zhang Z, Nangaku M, Hirokawa N. Kinesin family in murine central nervous system. J Cell Biol. 1992;119:1287–1296. - PMC - PubMed
    1. Barlet WP, Banker GA. An electron microscopic study of the development of axons and dendrites of hippocampal neurons in culture. II. Synaptic relationships. J Neurosci. 1984;4:1954–1965. - PMC - PubMed
    1. Bauerfeind R, Huttner WB. Biogenesis of constitutive secretory vesicles, secretory granules and synaptic vesicles. Curr Opin Cell Biol. 1993;5:628–635. - PubMed
    1. Brady ST. A novel brain ATPase with properties expected for the fast axonal transport motor. Nature. 1985;317:73–75. - PubMed

Publication types

MeSH terms