. 1998 Apr;180(8):2033-42.
doi: 10.1128/JB.180.8.2033-2042.1998.

Suppressor mutation analysis of the sensory rhodopsin I-transducer complex: insights into the color-sensing mechanism

Affiliations

Suppressor mutation analysis of the sensory rhodopsin I-transducer complex: insights into the color-sensing mechanism

K H Jung et al. J Bacteriol. 1998 Apr.

Abstract

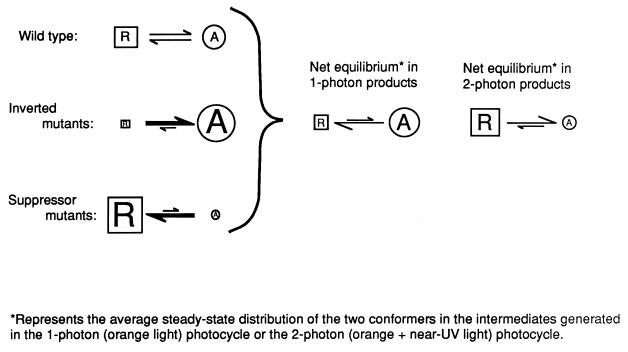
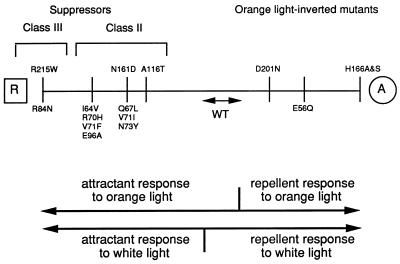
The molecular complex containing the phototaxis receptor sensory rhodopsin I (SRI) and transducer protein HtrI (halobacterial transducer for SRI) mediates color-sensitive phototaxis responses in the archaeon Halobacterium salinarum. One-photon excitation of the complex by orange light elicits attractant responses, while two-photon excitation (orange followed by near-UV light) elicits repellent responses in swimming cells. Several mutations in SRI and HtrI cause an unusual mutant phenotype, called orange-light-inverted signaling, in which the cell produces a repellent response to normally attractant light. We applied a selection procedure for intragenic and extragenic suppressors of orange-light-inverted mutants and identified 15 distinct second-site mutations that restore the attractant response. Two of the 3 suppressor mutations in SRI are positioned at the cytoplasmic ends of helices F and G, and 12 suppressor mutations in HtrI cluster at the cytoplasmic end of the second HtrI transmembrane helix (TM2). Nearly all suppressors invert the normally repellent response to two-photon stimulation to an attractant response when they are expressed with their suppressible mutant alleles or in an otherwise wild-type strain. The results lead to a model for control of flagellar reversal by the SRI-HtrI complex. The model invokes an equilibrium between the A (reversal-inhibiting) and R (reversal-stimulating) conformers of the signaling complex. Attractant light and repellent light shift the equilibrium toward the A and R conformers, respectively, and mutations are proposed to cause intrinsic shifts in the equilibrium in the dark form of the complex. Differences in the strength of the two-photon signal inversion and in the allele specificity of suppression are correlated, and this correlation can be explained in terms of different values of the equilibrium constant (Keq) for the conformational transition in different mutants and mutant-suppressor pairs.


Figures

FIG. 1
FIG. 1
Random PCR mutagenesis scheme. Plasmids and steps in the preparation of randomly mutated libraries of sopI, which encodes the SRI apoprotein, and the portion of htrI encoding the 230-residue region of HtrI that is N terminal to the methylation and signaling domains (see Materials and Methods).
FIG. 2
FIG. 2
Selection scheme for suppressor mutants. Cells were loaded between 0 and 8 mm from the end of the capillary. A repetitively flashing orange-light gradient was delivered to the 8- to 50-mm region, and cells were harvested from the 35- to 50-mm region of the capillary after ∼16 h. The rationale is that cells carrying SRI D201N or HtrI E56Q will respond to the orange-light flash as a repellent stimulus and reverse their swimming direction at the frequency of the flashing light (0.1 Hz), which impedes their migration through the capillary. The time-averaged spatial gradient of orange light favors the migration of suppressed mutants that exhibit attractant phototaxis over that of nonresponding mutants. For details, see Materials and Methods.
FIG. 3
FIG. 3
Positions of the residues in SRI and HtrI altered by suppressor mutations. Circled letters at the top represent specific helices. Asterisks indicate suppressor sites. Open circles indicate positions at which substitutions were observed to alter S373 lifetime in a previous study (13). α5 and α6 refer to homologous regions in eubacterial receptor/transducers (17). The relative arrangement of the transmembrane helices of SRI and HtrI was chosen arbitrarily.
FIG. 4
FIG. 4
Phototaxis responses. Cells contained, from left to right, wild-type SRI and HtrI (WT); wild-type SRI plus HtrI mutant E56Q, SRI mutant R215W plus HtrI mutant E56Q, the double SRI mutant R215W D201N plus wild-type HtrI, and SRI mutant R215W plus wild-type HtrI. Two seconds after initiation of data acquisition, the cells were exposed to 4-s removal of orange light (600 nm; top row), a 100-ms pulse of white light (spanning the range 380 to 600 nm; middle row), or a 4-s removal of white light (bottom row). Traces represent population reversal-frequency transients collected by computerized motion analysis at pH 6.0 and 40°C.
FIG. 5
FIG. 5
Phototaxis responses to near-UV light. Wild-type and mutant strains are as described for Fig. 4. Cells were exposed to a 100-ms pulse of near-UV light (400 nm) in a constant orange-light background.
FIG. 6
FIG. 6
Phototaxis response indices from strains with suppressor mutations in SRI. Positive values indicate attractant responses, and negative values indicate repellent responses. D201N, SRI mutant D201N; E56Q, HtrI mutant E56Q; WT, wild type. For each of the three SRI suppressor mutations, the first bar shows the suppressor combined with the D201N mutation, the second bar shows the suppressor combined with the E56Q mutation, and the third bar shows the suppressor mutation alone in otherwise wild-type SRI. Photostimuli were delivered as described in Materials and Methods.
FIG. 7
FIG. 7
Phototaxis response indices from strains with suppressor mutations in HtrI. Notation is as explained for Fig. 6.
FIG. 8
FIG. 8
Half-lives (t1/2) of S373 in membranes from cells containing suppressor mutations in an otherwise wild-type strain. The half-life of the decay of S373 to SR587 was measured with excitation at 590 nm, at pH 6.8 and 18°C. Twenty flash photolysis transients were averaged for each determination. Error bars are ±1 standard error of the mean for three determinations, and horizontal lines span 2 standard deviations of the mean for membranes from wild-type cells.
FIG. 9
FIG. 9
Proposed conformational equilibria of a wild-type signaling complex, the signaling complex of an orange-light-inverted mutant, (such as SRI D201N or HtrI E56Q), and the signaling complex of supersuppressor strains, such as SRI R215W or HtrI R84N. A and R represent the two conformations of the SRI-HtrI interface in different spectral species of SRI. Light-induced transformations that increase the concentration of the A or R conformation suppress or induce reversals, producing attractant or repellent responses, respectively. The A form predominates in the one-photon (orange-light-induced) products, and the R form predominates in the two-photon (white-light-induced) products. In the wild-type SRI-HtrI complex, the one-photon reaction increases the amount of the A form, and therefore causes an attractant response, whereas the two-photon reaction increases the amount of the R form, causing a repellent response. The basis of the orange-light-inverted phenotype is proposed to be a mutation-induced shift of the equilibrium in the SR587 species toward the A form. Repellent responses are therefore elicited by either one-photon or two-photon activation, because of the greater amounts of the R form in the equilibrium mixtures. Suppressors restore the one-photon-induced attractant response by shifting the equilibrium back toward the R form in SR587. Supersuppressors shift excessively into the R form, thus restoring the one-photon attractant response but concomitantly inverting the two-photon repellent response to an attractant response.
FIG. 10
FIG. 10
Relative bias of the dark equilibrium toward the R form (toward the left) or toward the A form (toward the right) of the wild-type (WT) signaling complex, the signaling complex of orange-light-inverted mutants, and the signaling complex of suppressed mutants. The range of values of Keq in which A and R are both present in sufficient amounts in the dark equilibrium mixture to yield wild-type behavior is placed at the center. Mutation-induced shifts of Keq for the dark equilibrium toward the R or A form lead to the indicated phenotypes, according to the model in Fig. 9 and as observed in this study. The relative ranking of Keq for different mutations is assigned on the basis of the abilities of mutations on the left to suppress the effects of those on the right and on the extent of inversion of the two-photon response produced by the mutation in wild-type or mutant strains.

References

    1. Bogomolni R A, Spudich J L. The photochemical reactions of bacterial sensory rhodopsin-I: flash photolysis study in the one microsecond to eight second time window. Biophys J. 1987;52:1071–1075. - PMC - PubMed
    1. Bogomolni R A, Stoeckenius W, Szundi I, Perozo E, Olson K D, Spudich J L. Removal of transducer HtrI allows electrogenic proton translocation by sensory rhodopsin I. Proc Natl Acad Sci USA. 1994;91:10188–10192. - PMC - PubMed
    1. Cadwell R C, Joyce G F. Randomization of genes by PCR mutagenesis. PCR Methods Appl. 1992;2:28–33. - PubMed
    1. Chen B, Przybyla A E. An efficient site-directed mutagenesis method based on PCR. BioTechniques. 1994;17:161–162. - PubMed
    1. Cline S W, Doolittle W F. Efficient transfection of the archaebacterium Halobacterium halobium. J Bacteriol. 1987;169:1341–1344. - PMC - PubMed

Publication types

MeSH terms

LinkOut - more resources