. 1998 May;72(5):4508-14.
doi: 10.1128/JVI.72.5.4508-4514.1998.

Feline coronavirus type II strains 79-1683 and 79-1146 originate from a double recombination between feline coronavirus type I and canine coronavirus

Affiliations

Feline coronavirus type II strains 79-1683 and 79-1146 originate from a double recombination between feline coronavirus type I and canine coronavirus

A A Herrewegh et al. J Virol. 1998 May.

Abstract

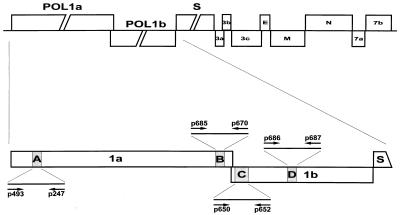
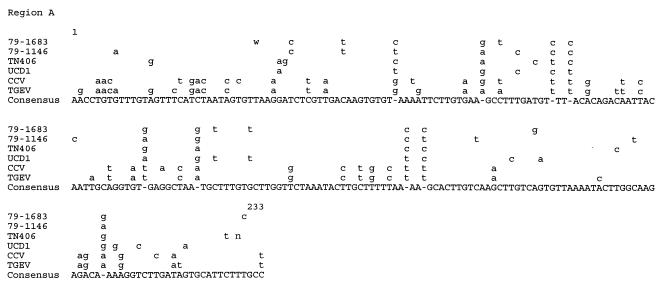
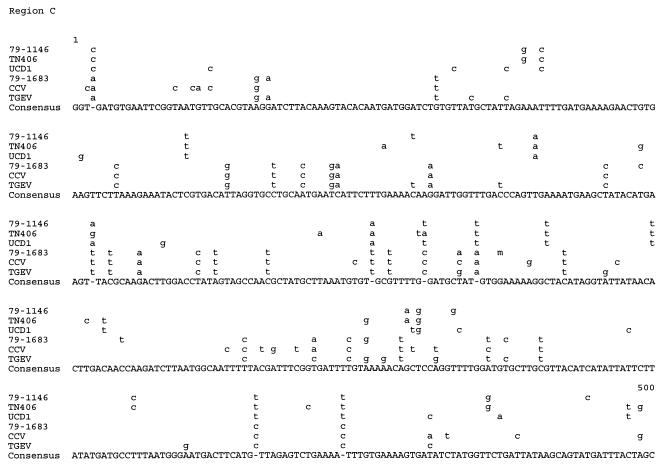
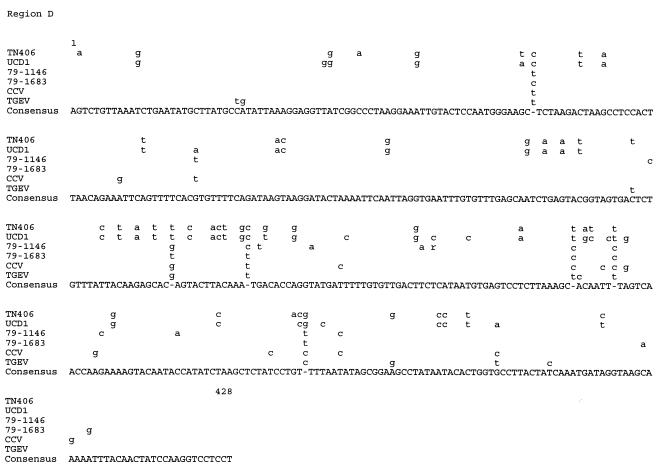
Recent evidence suggests that the type II feline coronavirus (FCoV) strains 79-1146 and 79-1683 have arisen from a homologous RNA recombination event between FCoV type I and canine coronavirus (CCV). In both cases, the template switch apparently took place between the S and M genes, giving rise to recombinant viruses which encode a CCV-like S protein and the M, N, 7a, and 7b proteins of FCoV type I (K. Motowaka, T. Hohdatsu, H. Hashimoto, and H. Koyama, Microbiol. Immunol. 40:425-433, 1996; H. Vennema, A. Poland, K. Floyd Hawkins, and N. C. Pedersen, Feline Pract. 23:40-44, 1995). In the present study, we have looked for additional FCoV-CCV recombination sites. Four regions in the pol gene were selected for comparative sequence analysis of the type II FCoV strains 79-1683 and 79-1146, the type I FCoV strains TN406 and UCD1, the CCV strain K378, and the TGEV strain Purdue. Our data show that the type II FCoVs have arisen from double recombination events: additional crossover sites were mapped in the ORF1ab frameshifting region of strain 79-1683 and in the 5' half of ORF1b of strain 79-1146.


Figures

FIG. 1
FIG. 1
Genomic organization of FCoV and an outline of the strategies used for the amplification of specific regions in the polymerase genes. (Upper panel) Schematic representation of the genome of FCoV strain 79-1146 with the various genes represented by boxes. The genes for the polymerase (POL1a, POL1b), the structural proteins S, M, E, and N, and the presumptive nonstructural proteins 3a, 3b, 3c, 7a, and 7b are indicated. (Lower panel) Schematic presentation of ORF1a and ORF1b, indicating the locations of regions A through D. The positions and polarities of the oligonucleotide primers used for RT-PCR amplification and sequence analysis are indicated.
FIG. 2
FIG. 2
Comparative sequence analysis of the M gene. An alignment is shown of the nucleotide sequences of the FCoV type I strains UCD1 and TN406 (37), the FCoV type II strains 79-1683 (15, 37) and 79-1146 (45), the CCV strain Insavc-1 (21), and the TGEV strain Purdue (40). Alignments were performed by using the PILEUP program (University of Wisconsin) (17). Only the nucleotides differing from the consensus sequence are depicted. Those nucleotides of the 79-1683 sequence which are identical to those of the CCV and TGEV sequences or to residues of at least two other FCoV strains are boxed. Template switching between the CCV and FCoV type I genomes apparently occurred in the region formed by nt 327 through 376 (underlined).
FIG. 3
FIG. 3
Comparative sequence analysis of genomic regions A through D. Alignments were made by using the PILEUP program (University of Wisconsin), which scores identity between every possible pair (17). Alignment of the nucleotide sequences of regions A through D, as determined for the FCoV type I strains UCD1 and TN406, the FCoV type II strains 79-1683 and 79-1146, the CCV strain K378, and the TGEV strain Purdue (11), is shown. Only those nucleotides differing from the consensus sequence are depicted. n, r, and w represent nucleotides A/C/G/T, A/G, and A/T, respectively.
FIG. 3
FIG. 3
Comparative sequence analysis of genomic regions A through D. Alignments were made by using the PILEUP program (University of Wisconsin), which scores identity between every possible pair (17). Alignment of the nucleotide sequences of regions A through D, as determined for the FCoV type I strains UCD1 and TN406, the FCoV type II strains 79-1683 and 79-1146, the CCV strain K378, and the TGEV strain Purdue (11), is shown. Only those nucleotides differing from the consensus sequence are depicted. n, r, and w represent nucleotides A/C/G/T, A/G, and A/T, respectively.
FIG. 4
FIG. 4
Percentages of nucleotide sequence identity between polymerase regions A to D of the FCoV type I and II strains, CCV, and TGEV.
FIG. 5
FIG. 5
Dendrograms schematically representing the sequence identity between polymerase regions A to D of FCoV type I and II strains, CCV, and TGEV. The similarity scores as calculated by the PILEUP program were used to create dendrograms by the unweighted pair-group method using arithmetic averages as described by Sneath and Sokal (42). The distances along the vertical axis are proportional to the number of nucleotide differences.
FIG. 6
FIG. 6
Recombination patterns of the FCoV strains 79-1146 and 79-1683. The schematic representations of the two virus genomes are as detailed in Fig. 1. Hatched boxes indicate parts of the FCoV type II genome thought to have originated from FCoV type I. Open boxes represent sequences apparently obtained from CCV. The regions where the template switches have taken place are underlined.

References

    1. Banner L R, Lai M M C. Random nature of coronavirus RNA recombination in the absence of selection pressure. Virology. 1991;185:441–445. - PMC - PubMed
    1. Baric R S, Fu K F, Schaad M C, Stohlman S A. Establishing a genetic recombination map of murine coronavirus strain A59 complementation groups. Virology. 1990;177:646–656. - PMC - PubMed
    1. Barlough J E, Stoddart C A, Sorresso G P, Jacobson R H, Scott F W. Experimental inoculation of cats with canine coronavirus and subsequent challenge with feline infectious peritonitis virus. Lab Anim Sci. 1984;34:592–597. - PubMed
    1. Brown C S, Welling-Wester S, Feijlbrief M, van Lent J W M, Spaan W J M. Chimeric parvovirus B19 capsids for the presentation of foreign epitopes. Virology. 1994;198:477–488. - PubMed
    1. Cavanagh D, Davis P J, Darbyshire J H, Peters R W. Coronavirus IBV: virus retaining spike glycopolypeptide S2 but not S1 is unable to induce virus-neutralizing or haemagglutination-inhibiting antibody or induce chicken tracheal protection. J Gen Virol. 1986;67:1435–1442. - PubMed

Publication types

LinkOut - more resources