. 1998 Apr 28;95(9):4841-6.
doi: 10.1073/pnas.95.9.4841.

Regulation of the zinc transporter ZnT-1 by dietary zinc

Affiliations

Regulation of the zinc transporter ZnT-1 by dietary zinc

R J McMahon et al. Proc Natl Acad Sci U S A. .

Abstract

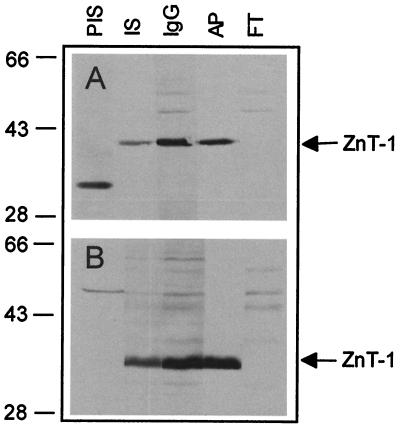
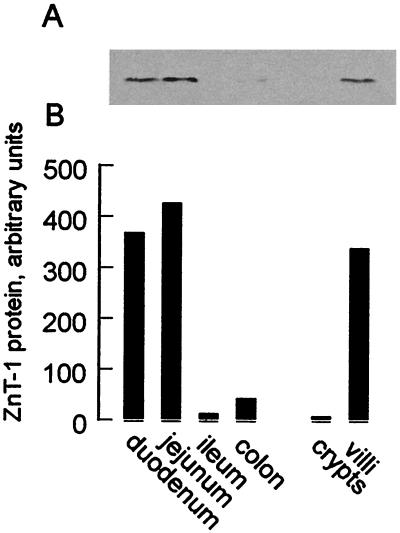
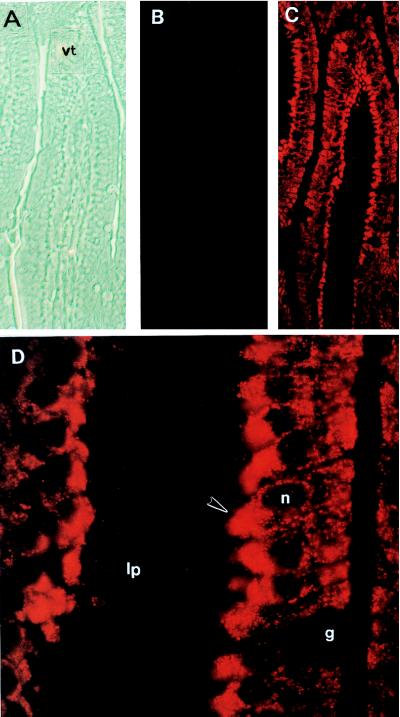
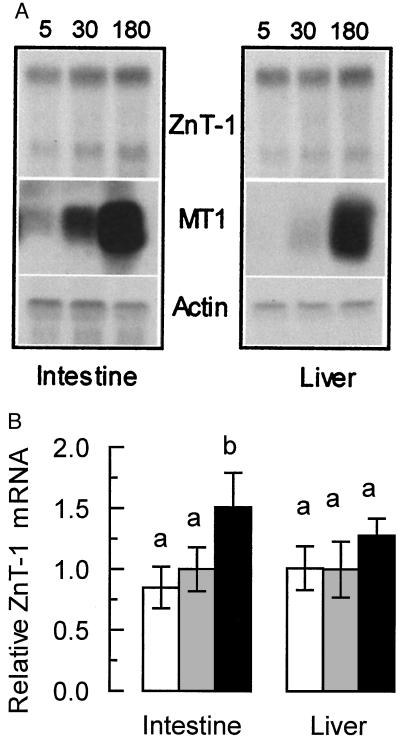
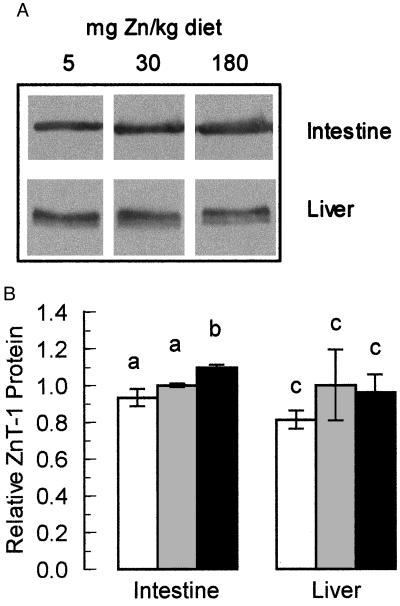
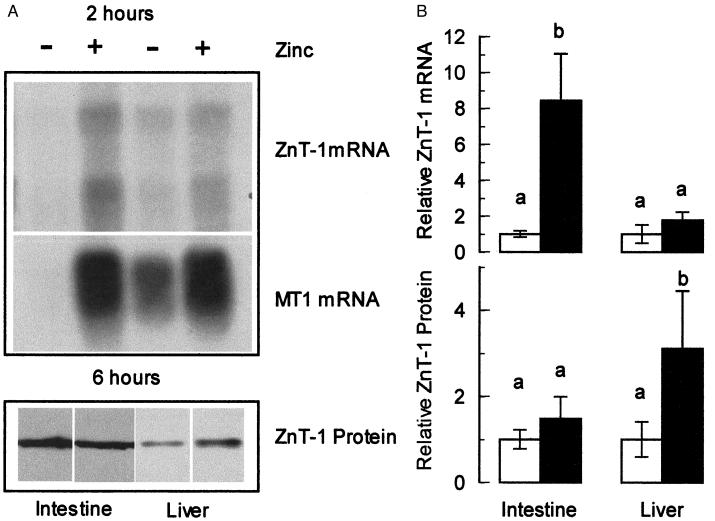
The understanding of mechanisms controlling zinc absorption and metabolism at the molecular level has advanced recently. Kinetics of zinc transport have been investigated for many years, but only recently have genes coding for proteins thought to be involved in the transport process been cloned. Four putative zinc transporters, known as ZnT-1 through ZnT-4, have now been described. Among these transporters, only ZnT-1 is ubiquitously expressed. In this report, we examine the pattern of ZnT-1 expression in the intestine and analyze the regulation of ZnT-1 by dietary zinc in both the intestine and liver. Immunofluorescence demonstrated that intestinal ZnT-1 was most abundant at the basolateral surface of enterocytes lining the villi of the duodenum and jejunum. By Western blot analysis, intestinal and liver ZnT-1 protein migrated as a 42- and 36-kDa protein, respectively. Dietary zinc supplementation elevated the level of intestinal ZnT-1 mRNA and protein approximately 50% and 10%, respectively, but had no effect in the liver. In response to an acute oral zinc dose, the level of intestinal ZnT-1 mRNA was up-regulated 8-fold, without a corresponding increase in ZnT-1 protein. Conversely, the acute oral dose did not affect liver ZnT-1 mRNA, but resulted in a 5-fold increase in liver ZnT-1 protein. These results represent studies on the expression of intestinal and hepatic ZnT-1 in an intact animal model. The data suggest that ZnT-1 is at least part of the mechanism by which dietary zinc is absorbed and that, despite the zinc responsiveness of the ZnT-1 gene, additional factors may be regulating the steady-state level of ZnT-1 transporter protein.


Figures

Figure 1
Figure 1
Specificity of rabbit ZnT-1 antibody. Membrane proteins (100 μg) from either rat intestinal mucosa (A) or liver (B) were resolved on a 10% SDS/PAGE gel and transferred to nitrocellulose. Blots were then probed with the indicated reagent. PIS, preimmune rabbit serum, 1:500 dilution; IS, whole immune serum, 1:500 dilution; and, prepared as described in Materials and Methods, IgG, total IgG fraction, 50 μg/ml; AP, affinity-purified antibody, 2.5 μg/ml; and FT, unbound antibody fraction from affinity purification, 50 μg/ml. Blots were incubated with 2° Ab-horseradish peroxidase conjugate and then visualized with enhanced chemiluminescence. The migration of prestained molecular mass markers is given on the left. Location of ZnT-1 is shown by an arrow.
Figure 2
Figure 2
Expression of ZnT-1 protein in intestinal regions. Mucosal scrapings were isolated from the intestine (duodenum, jejunum, ileum) and the colon. Crypt and villus cells were isolated as described in Materials and Methods. Membrane proteins (100 μg) were isolated, resolved on a 10% SDS/PAGE gel, and transferred to nitrocellulose. (A) ZnT-1 protein in each of these regions and cells examined by Western blot using affinity-purified anti-rat ZnT-1 antibody (Fig. 1) and visualized by chemiluminescence. (B) Densitometry of ZnT-1 protein levels.
Figure 3
Figure 3
Immunolocalization of intestinal ZnT-1 protein. Cross-sections from the rat intestine were processed for immunofluorescence as described in Materials and Methods. Micrographs are oriented with the villus tip at the top. (A) Phase-contrast image of intestinal villus, ×200 magnification. (B) Immunofluorescence of intestinal villus with the unbound antibody fraction from affinity purification of ZnT-1 antibody, ×200 magnification. (C) Immunofluorescence of ZnT-1 antibody of field of view shown in A, ×200 magnification. (D) Immunofluorescence of ZnT-1 antibody of intestinal villi, ×1,000 magnification of a section shown in C. lp, lamina propria; vt, villus tip; g, goblet cell; n, nucleus of the enterocyte. Arrowhead designates basolateral surface.
Figure 4
Figure 4
Expression of ZnT-1 mRNA in moderately zinc-restricted and moderately zinc-supplemented rats. Animals were fed purified diets containing 5, 30, or 180 mg Zn/kg for 1 week (n = 4 for each dietary level). Total RNA was then isolated from the intestine and liver of each animal. (A) Equal amounts of total RNA from each animal in a group were pooled and blotted for Northern analysis. The blot was probed for MT, ZnT-1, and β-actin mRNA as described in Materials and Methods. (B) Densitometric measurement of ZnT-1 levels. The relative values reported (mean ± SD) are derived from Northern blotting of RNA from each individual animal from each group followed by densitometry performed as described in Materials and Methods. Dietary zinc concentration was 5 (open bars), 30 (shaded bars), and 180 (solid bars) mg/kg. A statistically significant difference (P < 0.05) is indicated by a different letter above the bar. These results are representative of at least three individual diet studies.
Figure 5
Figure 5
Expression of ZnT-1 protein in moderately zinc-restricted and moderately zinc-supplemented rats. Animals were fed purified diets containing 5, 30, or 180 mg Zn/kg for 1 week. (A) Membrane proteins from the intestine and liver of each animal were isolated and probed for ZnT-1 protein by Western blot using affinity-purified anti-rat ZnT-1 antibody (Fig. 1). One representative of each group is shown. (B) Densitometry of ZnT-1 protein levels. The densitometric data, derived by blotting all protein samples individually, are plotted as mean ± SD (n = 4) relative to animals fed the adequate (30 mg Zn/kg) diet. Dietary zinc intake was 5 (open bars), 30 (shaded bars), and 180 (solid bars) mg/kg. A statistically significant difference (P < 0.05) is indicated by a different letter above the bar. These results are representative of at least two individual diet studies.
Figure 6
Figure 6
Expression of ZnT-1 in rats administered an oral zinc dose. Fasted animals were given an oral dose of either saline (−) or zinc sulfate (+) in saline (35 mg Zn/kg body weight). Samples for total RNA (after 2 h) or membrane protein (after 6 h) were obtained from the intestine and liver. (A) Northern blots of ZnT-1 mRNA (Top) or MT-1 mRNA (Middle) from saline- and zinc-treated animals were prepared as described in Fig. 4. Western blots of ZnT-1 protein (Bottom) from saline- and zinc-treated animals using affinity-purified anti-rat ZnT-1 antibody as described in Fig. 5. (B) Densitometry of ZnT-1 mRNA and protein in saline-gavaged (open bars) or zinc-gavaged (solid bars) animals. The densitometric data from Northern (Upper) or Western (Lower) blot were derived from individual samples (n = 4) and plotted as the mean ± SD relative to the saline-gavaged value. A statistically significant difference (P < 0.05) is indicated by a different letter above the bar. These results are representative of at least two individual oral dose studies.

References

    1. Cousins R J. In: Present Knowledge in Nutrition. 7th Ed. Filer L J, Ziegler E E, editors. Washington, DC: Int. Life Sci. Inst. Nutr. Foundation; 1996. pp. 293–306.
    1. Steel L, Cousins R J. Am J Physiol. 1985;248:G46–G53. - PubMed
    1. Hoadley J E, Leinart A S, Cousins R J. Am J Physiol. 1987;252:G825–G831. - PubMed
    1. Raffaniello R D, Lee S Y, Teichberg S, Wapnir R A. J Cell Physiol. 1992;152:356–361. - PubMed
    1. Ackland M L, Danks D M, McArdle H J. J Cell Physiol. 1988;135:521–526. - PubMed

Publication types

LinkOut - more resources