. 1998 Apr 28;95(9):4953-8.
doi: 10.1073/pnas.95.9.4953.

A stationary phase protein in Escherichia coli with binding activity to the major sigma subunit of RNA polymerase

Affiliations

A stationary phase protein in Escherichia coli with binding activity to the major sigma subunit of RNA polymerase

M Jishage et al. Proc Natl Acad Sci U S A. .

Abstract

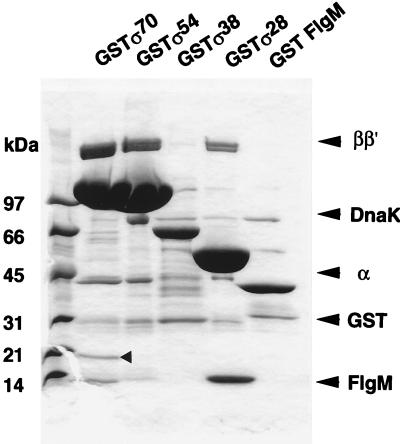
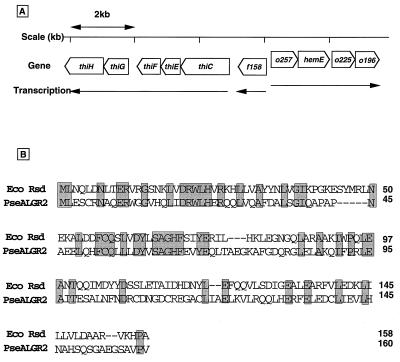
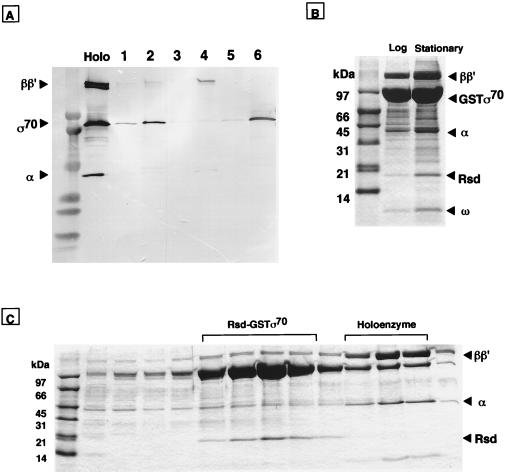
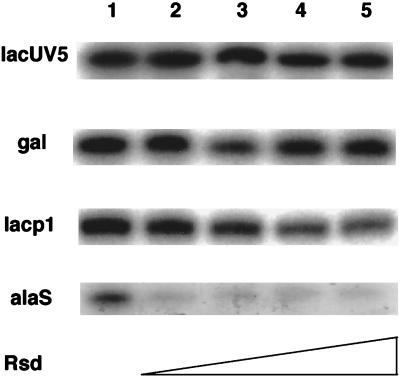
Switching of the transcription pattern in Escherichia coli during the growth transition from exponential to stationary phase is accompanied by the replacement of the RNA polymerase-associated sigma70 subunit (sigmaD) with sigma38 (sigmaS). A fraction of the sigma70 subunit in stationary phase cell extracts was found to exist as a complex with a novel protein, designated Rsd (Regulator of sigma D). The intracellular level of Rsd starts to increase during the transition from growing to stationary phase. The rsd gene was identified at 90 min on the E. coli chromosome. Overexpressed and purified Rsd protein formed complexes in vitro with sigma70 but not with other sigma subunits, sigmaN, sigmaS, sigmaH, sigmaF, and sigmaE. Analysis of proteolytic fragments of sigma70 indicated that Rsd binds at or downstream of region 4, the promoter -35 recognition domain. The isolated Rsd inhibited transcription in vitro to various extents depending on the promoters used. We propose that Rsd is a stationary phase E. coli protein with regulatory activity of the sigma70 function.


Figures

Figure 1
Figure 1
Identification of σ-associated proteins. Cells of E. coli W3110 containing pGEXD (lane GSTσ70), pGEXN (lane GSTσ54), pGEXS (lane GSTσ38), pGEXF (lane GSTσ28), or pGEXM (lane GST FlgM) were grown in LB medium at 37°C into stationary phase (3–4 h after the cessation of cell growth). Cell lysates were prepared as described under Materials and Methods. GST fusion protein complexes were isolated and separated by SDS/PAGE on a 5–15% gradient gel. The gel was stained with Coomassie brilliant blue. The migration positions of core enzyme subunits, DnaK, GST (without Rsd), and FlgM are indicated on the right. The arrow in the GSTσ70 lane indicates Rsd.
Figure 2
Figure 2
Map position of the rsd gene and the amino acid sequence of Rsd protein. (A) Map position of the rsd gene. From the amino acid sequence analysis of Rsd, the rsd gene was found to be identical with the f158 gene in the genome sequence (6). (B) The amino acid sequences of the Rsd protein and the P. aeruginosa AlgR2 protein are compared in optimized alignment. Identical residues are shaded.
Figure 3
Figure 3
Identification of complex formation between σ70 and Rsd. (A) Complex formation in vitro between Rsd and σ70 was analyzed by the GST pull down assay. GST (lanes 1, 3, and 5) or GST–Rsd (lanes 2, 4, and 6) was mixed with equimolar amounts of Eσ70 holoenzyme (lanes 1 and 2), core enzyme (lanes 3 and 4), or σ70 subunit (lanes 5 and 6). Complexes formed were bound to glutathione–Sepharose beads. The bead-bound proteins were eluted with 50 mM glutathione and separated by SDS/PAGE on a 5–15% gradient gel. The gel was subjected to Western blot analysis by using a mixture of monospecific antibodies against RNA polymerase α, β, β′, and σ70 subunits. The migration positions of RNA polymerase subunits can be identified in the holoenzyme lane. (B) Isolation of GST–σ70-associated proteins in cell extracts. Cell lysates of a pGEXD transformant of E. coli W3110 were prepared at both exponential (lane, log) and stationary (lane, stationary) phases. GST–σ70-bound proteins were isolated by the GST pull down assay, and the σ70-bound proteins were separated by SDS/13.5% PAGE. The migration positions of core enzyme subunits, GST–σ70, and ω proteins are indicated on the right. (C) Proteins isolated from stationary phase cells (see stationary lane in B) were subjected to heparin–Sepharose column chromatography. Proteins were eluted by a linear gradient of NaCl, and aliquots were analyzed by SDS/13.5% PAGE.
Figure 4
Figure 4
Identification of the Rsd binding subunit and Rsd contact site. (A) GST (lane 1) or GST–Rsd (lane 2) was mixed with an equimolar mixture of σ70, σ54(N), σ38(S), σ32(H), σ28(F), and σ24(E). Complexes were isolated by the GST pull down method with glutathione–Sepharose beads. The bead-bound proteins were eluted with 50 mM glutathione and analyzed by SDS/13.5% PAGE. The gel was subjected to Western blot analysis by using a mixture of antibodies against all six σ subunits. The control lane contained all six σ subunits, which all reacted against the antibody mixture. (B) Trypsin-treated σ70 (starting material, 1 nmol), shown in lane σ70/trypsin, was mixed with two different concentrations of GST–Rsd (lane 1, 40 pmol; lane 2, 20 pmol), and the complexes formed were isolated by the GST pull down assay with glutathione–Sepharose beads. The bead-bound proteins were eluted with 50 mM glutathione and separated by 5–15% SDS/PAGE. The gel was analyzed by Western blotting by using monospecific polyclonal antibodies against σ70. After N-terminal sequence analysis, R3–4 and R4 peptides were identified as C-terminal fragments downstream from 449 and 500, respectively.
Figure 5
Figure 5
Effect of Rsd on in vitro transcription. A fixed amount of σ70 (1 pmol) and increasing amounts of Rsd (lanes 2–5, 1, 2, 5, and 10 pmol) were preincubated for 10 min at 30°C in our standard transcription mixture containing 50 mM NaCl (24), and then 1 pmol of core enzyme was added. After 10 min at 37°C, a DNA fragment (1 pmol) carrying the indicated promoter was added, and the mixture was incubated at 37°C for 30 min to allow the open complex formation. RNA synthesis was initiated by adding a substrate/heparin mixture and continued for 5 min at 37°C. Transcripts were analyzed by electrophoresis on 6% or 8% polyacrylamide gels containing 8 M urea.
Figure 6
Figure 6
Measurement of the intracellular level of Rsd. E. coli W3110 type A strain (19) was grown in LB medium at 37°C. Growth was monitored with a Klett–Summerson photometer. At the times indicated, cell lysates were prepared according to the method described previously (8, 9). The protein concentration was determined by using a protein assay kit (Bio-Rad). Aliquots containing 10 μg of total protein were subjected to the quantitative Western blot assay as employed previously (8, 9) by using the ECL reagent system (Amersham) for detection of the membrane-bound anti-Rsd antibodies.

Similar articles

Cited by

References

    1. Helmann J D, Chamberlin M J. Annu Rev Biochem. 1988;57:839–872. - PubMed
    1. Gross C A, Lonetto M, Losick R. In: Transcription Regulation. McKnight S L, Yamamoto K R, editors. Plainview, NY: Cold Spring Harbor Lab. Press; 1992. pp. 129–176.
    1. Ishihama A. In: Mechanisms of Transcription. Eckstein F, Lilley D M J, editors. Berlin: Springer; 1997. pp. 53–70.
    1. Ishihama A, Taketo M, Saitoh T, Fukuda R. In: RNA Polymerase. Chamberlin M, Losick R, editors. Plainview, NY: Cold Spring Harbor Lab. Press; 1976. pp. 475–502.
    1. Ishihama A. In: Control of Cell Growth and Division. Ishihama A, Yoshikawa H, editors. Heidelberg: Springer; 1991. pp. 121–140.

Publication types

LinkOut - more resources