. 1998 Apr 28;95(9):4964-9.
doi: 10.1073/pnas.95.9.4964.

Phospholipid composition of the mammalian red cell membrane can be rationalized by a superlattice model

Affiliations

Phospholipid composition of the mammalian red cell membrane can be rationalized by a superlattice model

J A Virtanen et al. Proc Natl Acad Sci U S A. .

Abstract

Although the phospholipid composition of the erythrocyte membrane has been studied extensively, it remains an enigma as to how the observed composition arises and is maintained. We show here that the phospholipid composition of the human erythrocyte membrane as a whole, as well as the composition of its individual leaflets, is closely predicted by a model proposing that phospholipid head groups tend to adopt regular, superlattice-like lateral distributions. The phospholipid composition of the erythrocyte membrane from most other mammalian species, as well as of the platelet plasma membrane, also agrees closely with the predictions of the superlattice model. Statistical analyses indicate that the agreement between the observed and predicted compositions is highly significant, thus suggesting that head group superlattices may indeed play a central role in the maintenance of the phospholipid composition of the erythrocyte membrane.


Figures

Figure 1
Figure 1
Small unit cells for binary and ternary hexagonal SLs. (A–D) The smallest binary hexagonal unit cells contain 3, 4, 7, or 9 lattice sites, respectively. The molar percentages of the host (white) and guest (black) elements in the corresponding lattices are given below each unit cell. (E–J) Ternary unit cells derived from the 9-site binary cell. There are five different ternary cells with 9-lattice sites because J is a permuted form of I. The percentages of the black, white, and gray elements are shown below each unit cell, in that order. The lattice space groups are: E, p6mm; F, p3m1; G, p31m; H, p3; I and J, p31m.
Figure 2
Figure 2
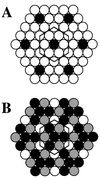
The proposed mean lateral arrangements of phospholipid classes in the outer and inner leaflet of the human erythrocyte membrane. (A) The proposed lateral arrangement of the head groups in the outer leaflet. The SL is based on unit cell D in Fig. 1, which predicts the abundance of 11.1 and 88.9 mol % of ethanolamine (black) and choline (white) lipids, respectively. (B) The proposed lateral arrangement in the inner leaflet. The SL is based on the ternary unit cell J in Fig. 1, predicting the molar percentages of 44.4, 33.3, and 22.2 for the ethanolamine (black), acidic (gray), and choline (white) phospholipid classes, respectively.
Figure 3
Figure 3
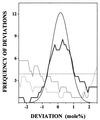
Graphical demonstration of the significance of the fit between observed and predicted compositions. The deviation of the overall PE molar percentages from the predicted ones was calculated for 17 different membranes (Tables 1–3), and the frequency of deviations was plotted against the magnitude of deviations (thick dotted line). The plot was smoothed by using the running point average method and 1.4 mol % window. The Gaussian curve represents the distribution of deviations predicted by the SL model with the assumption that the error in the experimental values (means) is 0.8 mol % on the average. This value, which defines the half-width of the Gaussian, was obtained by dividing SD by the square root of the number of determinations (assumed to be 4). The Gaussian has been shifted slightly (0.16 mol %) along the x axis to make comparison with the experimental curve easier. The distributions are plotted also for the hypothetical cases that: (i) the critical mole fraction interval would be 1/8 (thin continuous line) or (ii) 1/10 (dashed line) instead of the model predicted value of 1/9, or (iii) that no preferred compositions would exist, i.e., the concentration of PE could obtain any value between the experimental extremes 22.2 mol % (cat) and 35.9 mol % (buffalo) with equal probability (horizontal dotted line).

Similar articles

Cited by

References

    1. Somerharju P, Virtanen J A, Eklund K, Vainio P, Kinnunen P. Biochemistry. 1985;24:2773–2781. - PubMed
    1. Virtanen J A, Somerharju P, Kinnunen P K J. J Mol Electron. 1987;4:233–236.
    1. Tang D, Chong P L-G. Biophys J. 1992;63:903–910. - PMC - PubMed
    1. Chong P L-G. Proc Natl Acad Sci USA. 1994;91:10069–10073. - PMC - PubMed
    1. Parasassi T, Di Stefano M, Loiero M, Ravagnan G, Gratton E. Biophys J. 1995;66:763–768. - PMC - PubMed

Publication types

LinkOut - more resources