. 1998 Apr 28;95(9):5033-8.
doi: 10.1073/pnas.95.9.5033.

Targeted disruption of p70(s6k) defines its role in protein synthesis and rapamycin sensitivity

Affiliations

Targeted disruption of p70(s6k) defines its role in protein synthesis and rapamycin sensitivity

H Kawasome et al. Proc Natl Acad Sci U S A. .

Abstract

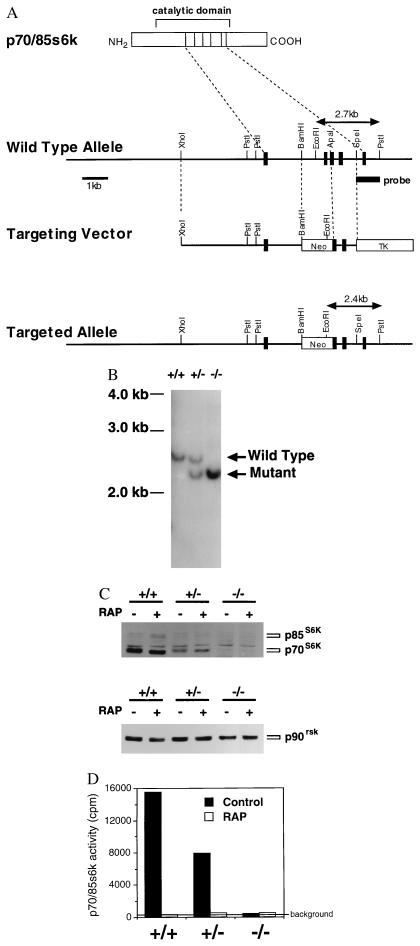
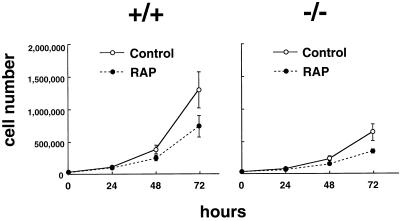
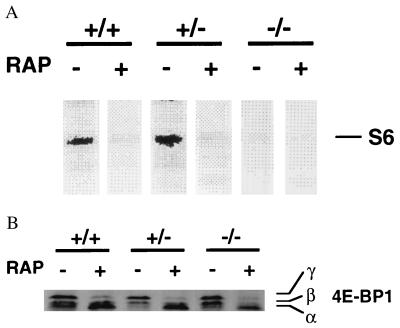
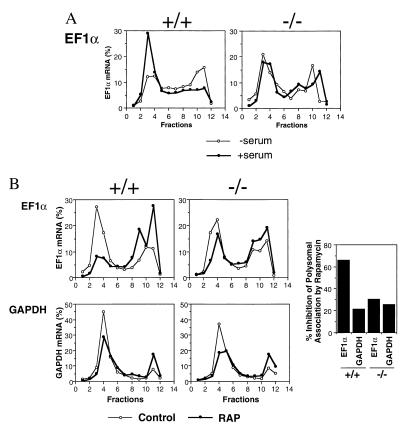
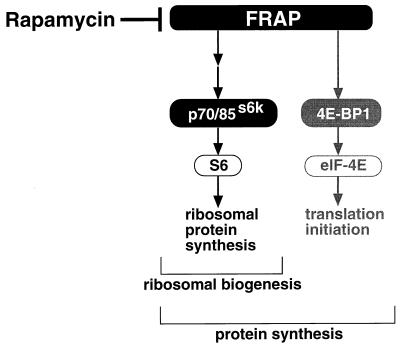
Here, we disrupted the p70 S6 kinase (p70(s6k)) gene in murine embryonic stem cells to determine the role of this kinase in cell growth, protein synthesis, and rapamycin sensitivity. p70(s6k-/-) cells proliferated at a slower rate than parental cells, suggesting that p70(s6k) has a positive influence on cell proliferation but is not essential. In addition, rapamycin inhibited proliferation of p70(s6k-/-) cells, indicating that other events inhibited by the drug, independent of p70(s6k), also are important for both cell proliferation and the action of rapamycin. In p70(s6k-/-) cells, which exhibited no ribosomal S6 phosphorylation, translation of mRNA encoding ribosomal proteins was not increased by serum nor specifically inhibited by rapamycin. In contrast, rapamycin inhibited phosphorylation of initiation factor 4E-binding protein 1 (4E-BP1), general mRNA translation, and overall protein synthesis in p70(s6k-/-) cells, indicating that these events proceed independently of p70(s6k) activity. This study localizes the function of p70(s6k) to ribosomal biogenesis by regulating ribosomal protein synthesis at the level of mRNA translation.


Figures

Figure 1
Figure 1
Targeted disruption of the p70s6k gene in mouse ES cells. (A) Structure of the wild-type allele, targeting vector, and targeted allele. A portion (14 kb) of the p70/85s6k gene was cloned from the 129SV mouse genomic library. The neo selection cassette was inserted in the opposite orientation at BamHI and ApaI sites to disrupt an exon encoding a part of the catalytic domain (corresponding amino acids 207–237 in the p70s6k protein). The downstream coding region is designed to be frame-shifted. PGKtk cassette was then cloned at the 3′ SpeI site. The resulting targeting vector featured 5 kb of homologous sequence on the long arm and 1.2 kb on the short arm. (B) Southern blotting. The R1 ES cell line was transfected with the targeting vector. Colonies were picked after 12 days in selection medium and expanded. For isolating cells homozygous for the targeted allele, a heterozygous clone was grown on feeder cells in 6 mg/ml G418. Resistant colonies were picked after 10 days in high-concentration selection medium. Genomic DNA was extracted from cultured cells, digested with PstI and EcoRI, and separated in 1% agarose gel. After denature and neutralization of the gel, DNA was transferred to nylon membrane and hybridized with the 1.0-kb probe indicated in A. (C) Western blotting. Cells were treated with either vehicle (0.1% ethanol, Control) or rapamycin (10 ng/ml, RAP) for 30 min. Proteins were extracted from cells, separated on SDS/8% polyacrylamide gels, and transferred to nitrocellulose membranes. Immunoblotting was performed by using the ECL method. Antibodies used here were: for p70s6k and p85s6k, a rabbit polyclonal antibody raised against the common carboxyl-terminal sequence (C18); for p90rsk, a rabbit polyclonal antibody raised against the carboxyl terminus of the kinase. (D) Kinase activity. Cells were prepared as described above. The specific activities of p70s6k and p85s6k were measured by using the C18 antibody and S6 peptide as a substrate.
Figure 2
Figure 2
Cell proliferation. p70s6k+/+ ES cells or p70s6k−/− ES cells were incubated in DMEM medium supplemented with 15% FCS and leukemia inhibitory factor (1,000 units/ml), in the presence or absence of rapamycin (10 ng/ml) for 72 hr. Cells were counted by using a Coulter counter (Hialeah, FL).
Figure 3
Figure 3
In vivo phosphorylation of S6 and 4E-BP1. (A) S6 phosphorylation in vivo. Cells were incubated with [32P]orthophosphate in phosphate-free medium in the presence or absence of rapamycin (10 ng/ml) for 3 hr. Cells were lysed in hypotonic buffer, and ribosomes were enriched by ultra centrifugation using a sucrose cushion. Ribosomal proteins were then separated on SDS/10% polyacrylamide gels, and phosphorylated S6 (≈32 kDa) was visualized by using the PhosphorImager and image quant analysis (Molecular Dynamics). (B) In vivo phosphorylation status of 4E-BP1. Cells were treated with vehicle or rapamycin as described in Fig. 1C. Protein extracts were separated on SDS/15% polyacrylamide gels and immunoblotted by using a rabbit polyclonal antibody raised against 4E-BP1. The band with the highest mobility (α) corresponds to hypophosphorylated 4E-BP1, and the bands with lower mobility (β, γ) correspond to hyperphosphorylated 4E-BP1 (23, 24, 28).
Figure 4
Figure 4
Polysomal association of EF-1α mRNA and GAPDH mRNA. (A) Effects of serum deprivation/addition. Cells were incubated in medium containing 0.1% FCS for 16 hr (−serum). FCS (15%) was added, and cells were incubated for another 3 hr (+serum). Polysomal mRNAs were separated from nonpolysomal mRNAs by sucrose gradient gels. mRNA in each fraction was slot-blotted and hybridized with a 32P-labeled cDNA probe for human EF-1α. Radioactivity of slot blots was scanned by using the PhosphorImager, and the relative counts in each fraction were determined by image quant analysis (shown as a percentage of the total counts in 12 fractions). Fractions 2–6 correspond to polysomal fractions determined by OD260 measurement (data not shown). (B) Effects of rapamycin. Cells were incubated in medium containing 0.1% FCS for 16 hr, then incubated in medium containing 15% FCS (Control) or 15% FCS plus rapamycin (10 ng/ml, RAP) for an additional 3 hr. Polysomal association of EF-1α mRNA or GAPDH mRNA was measured as described above. The percent inhibition of polysomal-associated EF-1α mRNA or GAPDH mRNA by rapamycin also is shown (Right).
Figure 5
Figure 5
A proposed model for the roles of p70s6k in protein synthesis.

References

    1. Brown E J, Schreiber S L. Cell. 1996;86:517–520. - PubMed
    1. Blenis J, Kuo C J, Erikson R L. J Biol Chem. 1987;262:14373–14376. - PubMed
    1. Jeno P, Ballou L M, Novak-Hofer I, Thomas G. Proc Natl Acad Sci USA. 1988;85:406–410. - PMC - PubMed
    1. Price D J, Nemenoff R A, Avruch J. J Biol Chem. 1989;264:13825–13833. - PubMed
    1. Ballou L M, Luther H, Thomas G. Nature (London) 1991;349:348–350. - PubMed

Publication types

MeSH terms

Associated data

LinkOut - more resources