

Toward a resolution of the introns early/late debate: only phase zero introns are correlated with the structure of ancient proteins
- PMID: 9560234
- PMCID: PMC20219
- DOI: 10.1073/pnas.95.9.5094
Toward a resolution of the introns early/late debate: only phase zero introns are correlated with the structure of ancient proteins
Abstract
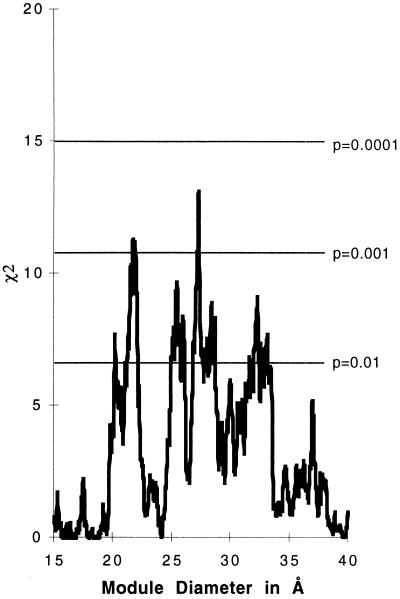
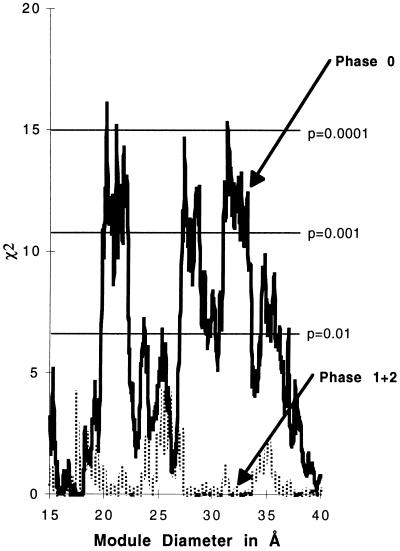
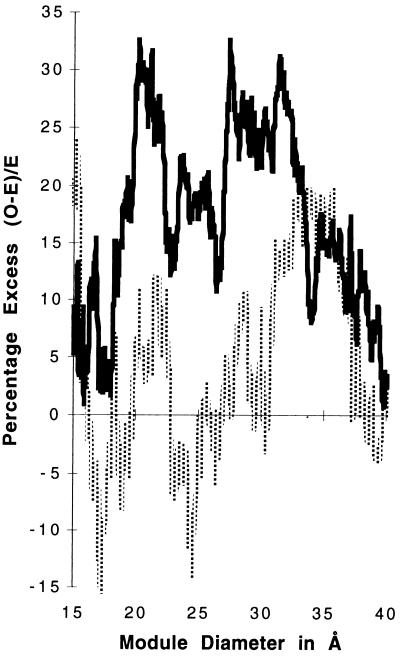
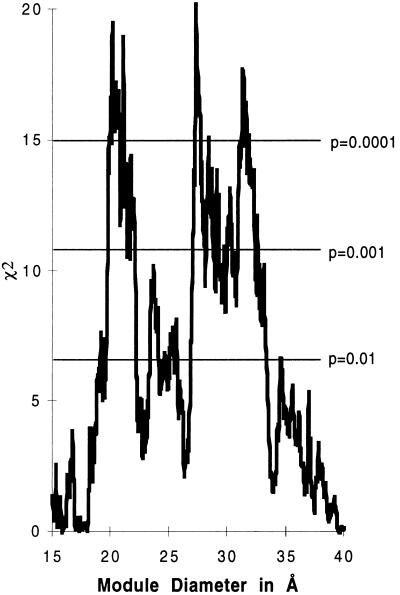
We present evidence that a well defined subset of intron positions shows a non-random distribution in ancient genes. We analyze a database of ancient conserved regions drawn from GenBank 101 to retest two predictions of the theory that the first genes were constructed by exon shuffling. These predictions are that there should be an excess of symmetric exons (and sets of exons) flanked by introns of the same phase (positions within the codon) and that intron positions in ancient proteins should correlate with the boundaries of compact protein modules. Both these predictions are supported by the data, with considerable statistical force (P values < 0.0001). Intron positions correlate to modules of diameters around 21, 27, and 33 A, and this correlation is due to phase zero introns. We suggest that 30-40% of present day intron positions in ancient genes correspond to phase zero introns originally present in the progenote, while almost all of the remaining intron positions correspond to introns added, or moved, appearing equally in all three intron phases. This proposal provides a resolution for many of the arguments of the introns-early/introns-late debate.
Figures
References
-
- Cavalier-Smith T. Trends Genet. 1991;7:145–148. - PubMed
-
- Palmer J D, Logsdon J M J. Curr Opin Genet Dev. 1991;1:470–477. - PubMed
-
- Doolittle W F. Nature (London) 1978;272:581–582.
-
- Gilbert W. Introns and Exons: Playgrounds of Evolution. New York: Academic Press; 1979.
-
- Gilbert W. Cold Spring Harbor Symp Quant Biol. 1987;52:901–905. - PubMed
Publication types
MeSH terms
Substances
LinkOut - more resources
Full Text Sources
Other Literature Sources
