. 1998 May;18(5):2571-85.
doi: 10.1128/MCB.18.5.2571.

Multiple Grb2-mediated integrin-stimulated signaling pathways to ERK2/mitogen-activated protein kinase: summation of both c-Src- and focal adhesion kinase-initiated tyrosine phosphorylation events

Affiliations

Multiple Grb2-mediated integrin-stimulated signaling pathways to ERK2/mitogen-activated protein kinase: summation of both c-Src- and focal adhesion kinase-initiated tyrosine phosphorylation events

D D Schlaepfer et al. Mol Cell Biol. 1998 May.

Abstract

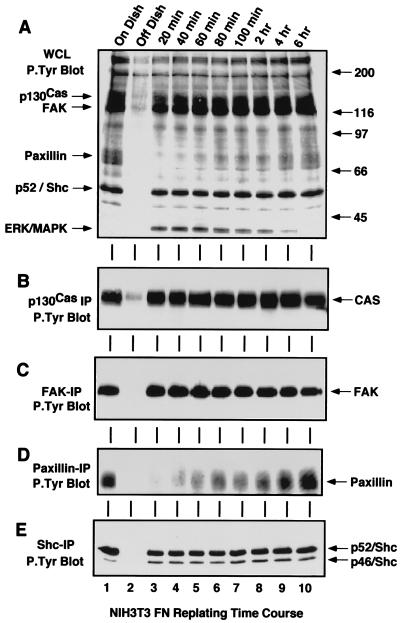
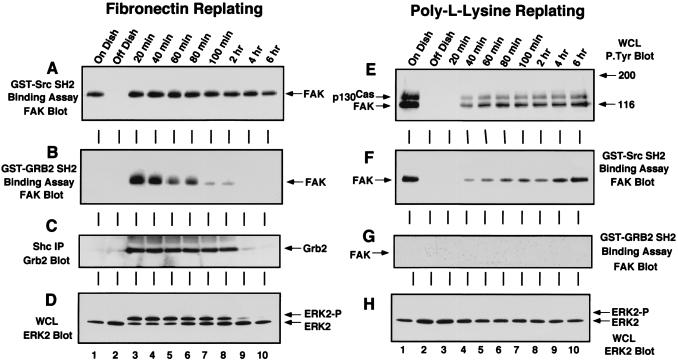
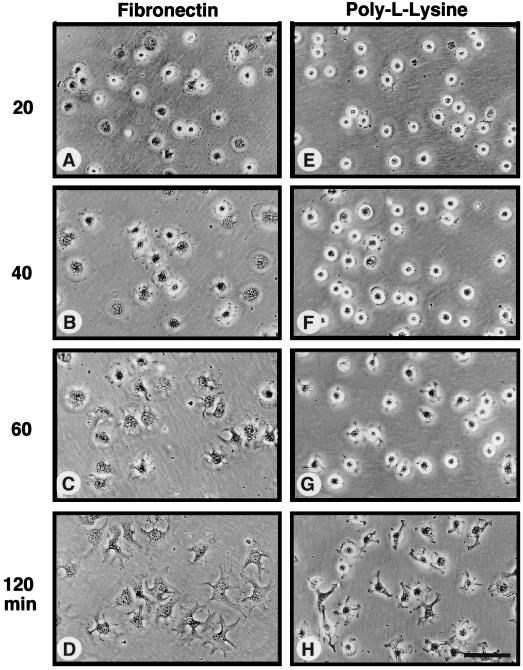
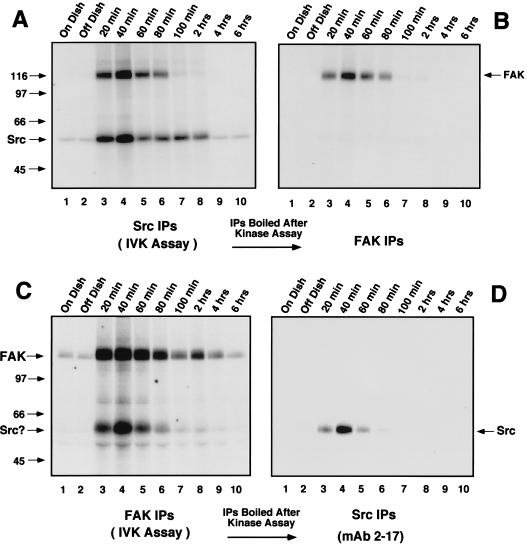
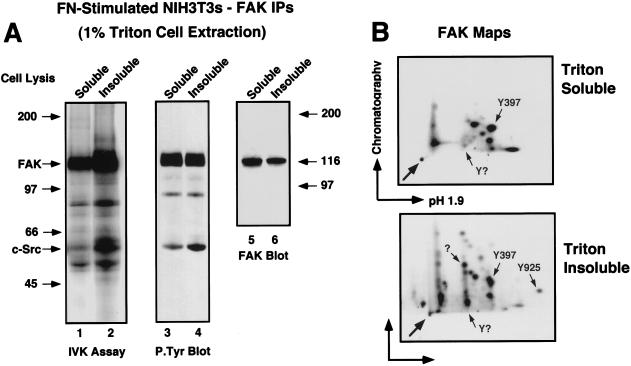
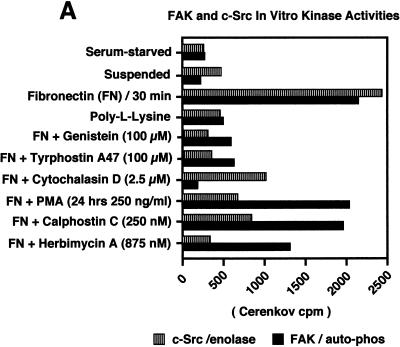
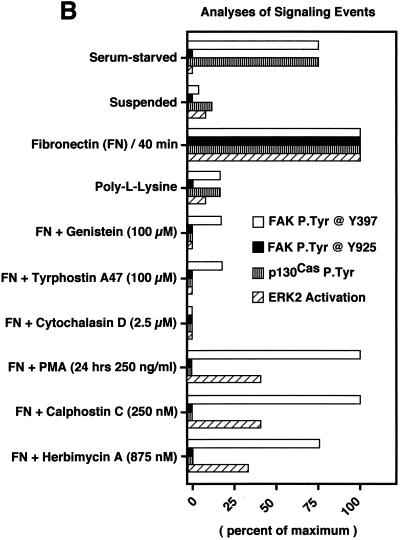
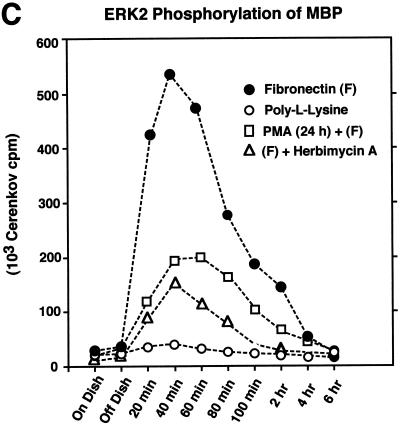
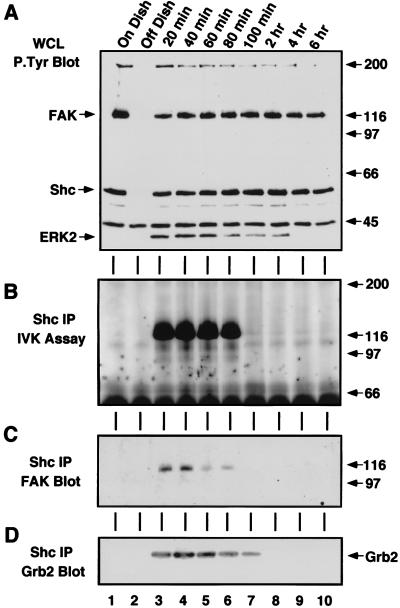
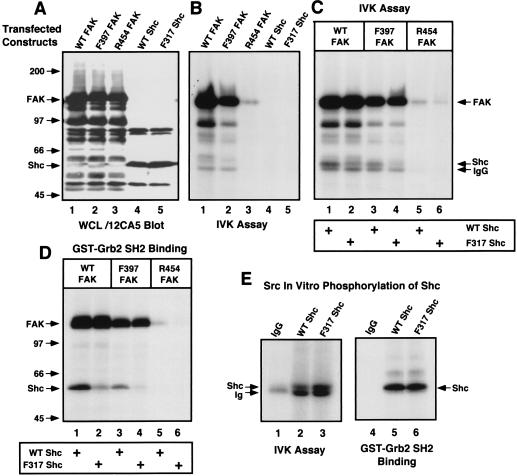
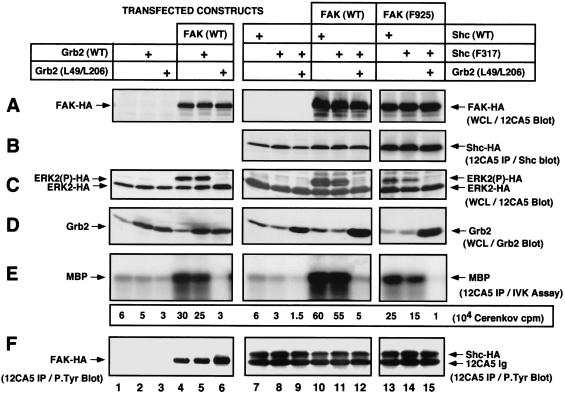
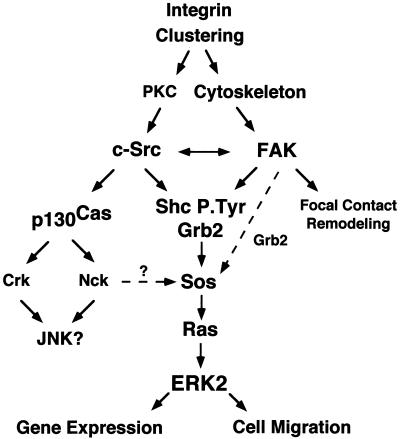
Fibronectin receptor integrin-mediated cell adhesion triggers intracellular signaling events such as the activation of the Ras/mitogen-activated protein (MAP) kinase cascade. In this study, we show that the nonreceptor protein-tyrosine kinases (PTKs) c-Src and focal adhesion kinase (FAK) can be independently activated after fibronectin (FN) stimulation and that their combined activity promotes signaling to extracellular signal-regulated kinase 2 (ERK2)/MAP kinase through multiple pathways upstream of Ras. FN stimulation of NIH 3T3 fibroblasts promotes c-Src and FAK association in the Triton-insoluble cell fraction, and the time course of FN-stimulated ERK2 activation paralleled that of Grb2 binding to FAK at Tyr-925 and Grb2 binding to Shc. Cytochalasin D treatment of fibroblasts inhibited FN-induced FAK in vitro kinase activity and signaling to ERK2, but it only partially inhibited c-Src activation. Treatment of fibroblasts with protein kinase C inhibitors or with the PTK inhibitor herbimycin A or PP1 resulted in reduced Src PTK activity, no Grb2 binding to FAK, and lowered levels of ERK2 activation. FN-stimulated FAK PTK activity was not significantly affected by herbimycin A treatment and, under these conditions, FAK autophosphorylation promoted Shc binding to FAK. In vitro, FAK directly phosphorylated Shc Tyr-317 to promote Grb2 binding, and in vivo Grb2 binding to Shc was observed in herbimycin A-treated fibroblasts after FN stimulation. Interestingly, c-Src in vitro phosphorylation of Shc promoted Grb2 binding to both wild-type and Phe-317 Shc. In vivo, Phe-317 Shc was tyrosine phosphorylated after FN stimulation of human 293T cells and its expression did not inhibit signaling to ERK2. Surprisingly, expression of Phe-925 FAK with Phe-317 Shc also did not block signaling to ERK2, whereas FN-stimulated signaling to ERK2 was inhibited by coexpression of an SH3 domain-inactivated mutant of Grb2. Our studies show that FN receptor integrin signaling upstream of Ras and ERK2 does not follow a linear pathway but that, instead, multiple Grb2-mediated interactions with Shc, FAK, and perhaps other yet-to-be-determined phosphorylated targets represent parallel signaling pathways that cooperate to promote maximal ERK2 activation.


Figures

FIG. 1
FIG. 1
Tyrosine phosphorylation of p130Cas, FAK, paxillin, and Shc is not always associated with FN-stimulated signaling events. NIH 3T3 fibroblasts were either serum-starved “On Dish” (lane 1), held in suspension for 30 min “Off Dish” (lane 2), or replated onto FN-coated dishes for the times indicated (lanes 3 to 10). RIPA buffer-treated cell lysates were equalized for protein content and ∼100 μg of WCL (A), or IPs from ∼500 μg of WCL were made with p130Cas (B), FAK (C), paxillin (D), or Shc (E) antibodies. The samples were resolved by SDS-PAGE, analyzed by anti-P.Tyr blotting, and visualized by enhanced chemiluminescence (ECL) detection. Arrows indicate the positions of p130Cas, FAK, paxillin, Shc, and ERK2. ECL exposure time for panel A was 30 s.
FIG. 2
FIG. 2
Grb2 SH2 domain binding to FAK and Shc is stimulated by FN replating of NIH 3T3 cells and correlates with the period of ERK2 activation. NIH 3T3 fibroblasts were either serum-starved “On Dish” (lane 1), held in suspension for 30 min “Off Dish” (lane 2), or replated onto FN-coated (A to D) or PLL-coated (E to H) dishes for the times indicated (lanes 3 to 10). FN-stimulated cell lysates were analyzed by GST-Src SH2 (A) or GST-Grb2 SH2 (B) binding assays, and FAK associated with the SH2 domains was visualized by anti-FAK blotting after SDS-PAGE. (C) Grb2 associated with polyclonal Shc IPs from FN-stimulated cell lysates was visualized by anti-Grb2 blotting after SDS-PAGE. (D) A 100-μg sample of FN-stimulated WCL was resolved by SDS-PAGE and analyzed by ERK2 blotting. (E) A 100-μg sample of PLL-stimulated WCL was resolved by SDS-PAGE and analyzed by anti-P.Tyr blotting. GST-Src SH2 (F) and GST-Grb2 (G) binding assays were performed with PLL-stimulated cell lysates, and FAK associated with the SH2 domains was visualized by anti-FAK blotting after SDS-PAGE. (H) A 100-μg sample of PLL-stimulated WCL was resolved by SDS-PAGE and analyzed by ERK2 blotting.
FIG. 3
FIG. 3
Time course of FN-stimulated cell spreading compared to NIH 3T3 cell adhesion to PLL. Serum-starved NIH 3T3 fibroblasts were held in suspension for 30 min and plated (1.3 × 10⁴ cells/cm2) onto either FN-coated (A to D) or PLL-coated (E to H) cell culture dishes. At the times indicated, phase-contrast micrographs were taken with a Nikon inverted microscope (Nikon, Inc., Melville, N.Y.) equipped with a 40× objective lens and photographed with T-MAX 400 film (Kodak). Scale bar, ca. 100 μm.
FIG. 4
FIG. 4
Transient associations between FAK and c-Src detected during the time course of FN-stimulated cell spreading and signaling to ERK2. NIH 3T3 fibroblasts were either serum-starved “On Dish” (lane 1), held in suspension for 30 min “Off Dish” (lane 2), or replated onto FN-coated dishes for the times indicated (lanes 3 to 10). Cell lysates were equalized for protein content (∼1 mg of total cell protein) and either c-Src (A) or FAK (C) IPs were labeled by the addition of [γ-32P]ATP in an in vitro kinase assay. Aliquots of the labeled c-Src or FAK IPs were either resolved by SDS-PAGE and visualized by autoradiography (A and C) or boiled, diluted, and reimmunoprecipitated with antibodies to FAK (B) or c-Src (D). The secondary IPs were resolved by SDS-PAGE and visualized by autoradiography. Arrows indicate the positions of c-Src and FAK.
FIG. 5
FIG. 5
Localization of activated FAK and c-Src to the Triton-insoluble fraction of NIH 3T3 fibroblasts after FN stimulation. (A) NIH 3T3 cells were plated onto FN for 30 min and extracted with 1% Triton lysis buffer, and the Triton-insoluble cell material was secondarily extracted with RIPA lysis buffer as described in Materials and Methods. FAK IPs made from the Triton-soluble or insoluble fractions were labeled in vitro by the addition of [γ-32P]ATP and resolved by SDS-PAGE (lanes 1 and 2) or separately analyzed by anti-P.Tyr (lanes 3 and 4) and anti-FAK immunoblotting (lanes 5 and 6). (B) The 32P-labeled FAK bands in A were digested with trypsin and processed for phosphopeptide mapping analyses (pH 1.9, 1,000 V, 1 h). Arrows within the panels indicate known positions of FAK tryptic phosphopeptides. The horizontal and vertical arrows indicate the directions of electrophoretic (arrow points to cathode) and chromatographic separation, respectively. The arrow in the lower left corner of each panel indicates the sample origin.
FIG. 6
FIG. 6
FAK and c-Src activities are regulated independently after FN stimulation. The effects of pharmacological inhibitors on FN-stimulated signaling events and ERK2 activation are demonstrated. Cell lysates were prepared from serum-starved, suspended, PLL- and FN-plated NIH 3T3 cells (30 min) in the presence of the indicated pharmacological inhibitors. (A) Quantitative analyses are shown of c-Src in vitro kinase activity toward acid-denatured enolase (striped boxes) or FAK (black boxes) in vitro autophosphorylation activity. The total cell protein was normalized prior to the immunoprecipitation and in vitro kinase assays. The 32P-labeled enolase or FAK bands were quantitated by Cerenkov counting, and the values represent the average of three separate experiments. (B) Comparisons of FAK tyrosine phosphorylation at Tyr-397 as measured by GST-Src SH2 binding and FAK blotting (white boxes), FAK phosphorylation at Tyr-925 as measured by GST-Grb2 SH2 binding and FAK blotting (black boxes), p130Cas tyrosine phosphorylation as measured by p130Cas IP and anti-P.Tyr blotting (striped boxes), and ERK2 activation as measured by band shifts in ERK2 blotting of WCLs (hatched boxes). The extent of positive values was quantitated by scanning ECL-derived images on a flatbed scanner and performing densitometric analyses with the software program NIH Image. Values, averaged from two separate experiments, are expressed as the percentage of maximum as determined by the FN plating control. PLL- or FN-plated-cell analyses were performed at 30 min, and qualitative ERK2 activation was performed by measuring the intensity of the slower-migrating phosphorylated ERK2 band (see Fig. 2D). (C) Cell lysates, made at the time points indicated from NIH 3T3 fibroblasts replated on FN (closed circles), on PLL (open circles), or on FN after PKC down-regulation by PMA treatment for 24 h (open squares) or by 24-h herbimycin A treatment (open triangles), were equalized for protein content prior to ERK2 immunoprecipitation and kinase assays. ERK2 in vitro kinase activity was measured by the phosphorylation of MBP. The amount of 32P incorporated into MBP was determined by Cerenkov counting, and the points represent the average of two separate experiments.
FIG. 6
FIG. 6
FAK and c-Src activities are regulated independently after FN stimulation. The effects of pharmacological inhibitors on FN-stimulated signaling events and ERK2 activation are demonstrated. Cell lysates were prepared from serum-starved, suspended, PLL- and FN-plated NIH 3T3 cells (30 min) in the presence of the indicated pharmacological inhibitors. (A) Quantitative analyses are shown of c-Src in vitro kinase activity toward acid-denatured enolase (striped boxes) or FAK (black boxes) in vitro autophosphorylation activity. The total cell protein was normalized prior to the immunoprecipitation and in vitro kinase assays. The 32P-labeled enolase or FAK bands were quantitated by Cerenkov counting, and the values represent the average of three separate experiments. (B) Comparisons of FAK tyrosine phosphorylation at Tyr-397 as measured by GST-Src SH2 binding and FAK blotting (white boxes), FAK phosphorylation at Tyr-925 as measured by GST-Grb2 SH2 binding and FAK blotting (black boxes), p130Cas tyrosine phosphorylation as measured by p130Cas IP and anti-P.Tyr blotting (striped boxes), and ERK2 activation as measured by band shifts in ERK2 blotting of WCLs (hatched boxes). The extent of positive values was quantitated by scanning ECL-derived images on a flatbed scanner and performing densitometric analyses with the software program NIH Image. Values, averaged from two separate experiments, are expressed as the percentage of maximum as determined by the FN plating control. PLL- or FN-plated-cell analyses were performed at 30 min, and qualitative ERK2 activation was performed by measuring the intensity of the slower-migrating phosphorylated ERK2 band (see Fig. 2D). (C) Cell lysates, made at the time points indicated from NIH 3T3 fibroblasts replated on FN (closed circles), on PLL (open circles), or on FN after PKC down-regulation by PMA treatment for 24 h (open squares) or by 24-h herbimycin A treatment (open triangles), were equalized for protein content prior to ERK2 immunoprecipitation and kinase assays. ERK2 in vitro kinase activity was measured by the phosphorylation of MBP. The amount of 32P incorporated into MBP was determined by Cerenkov counting, and the points represent the average of two separate experiments.
FIG. 7
FIG. 7
Detection of in vivo FN-stimulated FAK, Shc, and Grb2 associations in the absence of Src family PTK activity. Cell lysates were made at the time points indicated from NIH 3T3 fibroblasts serum starved and treated with herbimycin A (875 nM) for 24 h prior to and during FN plating. (A) RIPA cell lysates were equalized for protein content, and ∼250 μg of WCL was analyzed by anti-P.Tyr blotting; ECL exposure time was ∼2 min. The relative levels of both FAK and Shc tyrosine phosphorylation in the herbimycin A-treated cells are reduced compared to levels in the control (∼100 μg) cell lysates (see Fig. 1). (B) Polyclonal Shc IPs from ∼1 mg of RIPA lysate were labeled by the addition of [γ-32P]ATP in an in vitro kinase (IVK) assay, and the proteins associated with Shc were resolved by SDS-PAGE, transferred to a polyvinylidene difluoride membrane, and visualized by autoradiography. (C) Anti-FAK blotting was performed on the Shc IP-containing membrane shown in panel B. (D) Transient Grb2 association with polyclonal Shc IPs from ∼500 μg of RIPA lysates was visualized by anti-Grb2 blotting.
FIG. 8
FIG. 8
Direct phosphorylation of Shc by FAK or c-Src in vitro promotes Grb2 binding. (A) Human 293T cells were transiently transfected with either hemagglutinin epitope-tagged WT FAK, Phe-397 FAK, Arg-454 FAK, WT Shc, or Phe-317 Shc, and recombinant protein expression in WCLs was analyzed by immunoblotting with the 12CA5 monoclonal antibody to the hemagglutinin epitope tag. (B) Serum-starved 293T cells transfected with the indicated FAK or Shc constructs were stimulated (lanes 1 to 3) with PMA (250 ng/ml, 10 min), and kinase activity associated with 12CA5 IPs was measured by the addition of [γ-32P]ATP in an in vitro kinase (IVK) assay. (C) As shown in panel B, 12CA5 IPs of the indicated FAK proteins expressed in 293T cells stimulated with PMA were mixed with 12CA5 IPs of the indicated Shc proteins from serum-starved cells, and the proteins were labeled by the addition of [γ-32P]ATP in an in vitro kinase assay. (D) The products of duplicate reactions shown in panel C were denatured by the addition of SDS and boiling, diluted, and incubated with purified GST-Grb2 SH2 domain (5 μg). The labeled proteins associated with the Grb2 SH2 domain were visualized by autoradiography. The identities of FAK and Shc were confirmed by 12CA5 immunoblotting (data not shown). (E) Purified mouse c-Src (25 ng) was incubated with 12CA5 IPs from nontransfected 293T cells (lane 1) and from 293T cells transfected with WT (lane 2) or Phe-317 (lane 3) Shc, and the proteins were labeled by the addition of [γ-32P]ATP in an in vitro kinase assay. Grb2 SH2 domain-bound proteins (lanes 4 to 6) were isolated from duplicate in vitro kinase reactions. The identity of Shc was confirmed by 12CA5 immunoblotting (data not shown).
FIG. 9
FIG. 9
Shc Phe-317 overexpression does not block FN-stimulated or FAK-enhanced Grb2-mediated signaling to ERK2. 293T cells were transiently transfected with hemagglutinin-tagged ERK2 in addition to the indicated expression constructs, and RIPA cell lysates were prepared after cell stimulation with FN in the absence of serum (20 min). FAK (A) and ERK2 (C) expression as detected by 12CA5 immunoblotting of ∼100 μg of WCL is shown. (B) Shc expression as detected by 12CA5 IPs followed by anti-Shc polyclonal immunoblotting. (D) Endogenous and recombinant Grb2 expression as determined by polyclonal Grb2 immunoblotting of ∼100 μg of WCL as resolved by SDS–17.5% PAGE. (E) Hemagglutinin-tagged ERK2 activity toward MBP as determined by 12CA5 IP in vitro kinase (IVK) assays in the presence of [γ-32P]ATP. The amount of 32P incorporated into MBP was determined by Cerenkov counting. The values shown represent the average of two separate experiments. (F) Analyses of FAK (lanes 1 to 6) or Shc (lanes 7 to 14) tyrosine phosphorylation in vivo as determined by monoclonal antibody anti-P.Tyr immunoblotting analyses of 12CA5 IPs. Cross-reactivity of the 12CA5 immunoglobulin chain with anti-mouse ECL detection reagents is indicated (lanes 7 to 14). Lanes 1 to 6, 7 to 12, and 13 to 15 are from separate experiments.
FIG. 10
FIG. 10
Model of the integrin signaling network to ERK2. FN stimulation of cells promotes integrin clustering and signals that can independently activate FAK or Src family PTKs. Integrin-stimulated c-Src activation may be downstream of PKC-mediated events, whereas integrin-stimulated FAK activation is dependent upon the integrity of the actin cytoskeleton. FAK and c-Src transiently associate and translocate to the Triton-insoluble fraction of cells after FN stimulation, and this association may mutually enhance and extend the time course of their integrin-stimulated PTK activity. Both FAK and c-Src can phosphorylate Shc at multiple sites to promote Grb2 adapter protein binding, whereas c-Src phosphorylation of FAK at Tyr-925 also promotes Grb2 binding. Grb2 SH3 domain association with the Sos GDP-GTP exchange protein can activate Ras, and ERK2/MAP kinase is one downstream target of Ras-mediated signaling events. It is proposed that maximal signaling to ERK2 would result from the stimulation of multiple pathways, whereas lower levels of integrin-stimulated signaling to ERK2 can occur in the absence of either Src family or FAK PTK activity. Integrin-stimulated c-Src PTK activity promotes p130Cas tyrosine phosphorylation and Crk and Nck adaptor protein binding to p130Cas, which may link integrins to the activation JNK or ERK2/MAP kinase pathways. Integrin-activated ERK2 may function to promote gene transcription by phosphorylation of targets in the nucleus or ERK2 may promote cell migration through phosphorylation and enhanced activation of myosin light-chain kinase (29). FAK may play multiple roles as a scaffold for the recruitment of signaling proteins and function in the processes of cell substratum remodeling events during cell spreading or migration.

References

    1. Bellis S L, Perrotta J A, Curtis M S, Turner C E. Adhesion of fibroblasts to fibronectin stimulates both serine and tyrosine phosphorylation of paxillin. Biochem J. 1997;325:375–381. - PMC - PubMed
    1. Blaikie P A, Fournier E, Dilworth S M, Birnbaum D, Borg J P, Margolis B. The role of the Shc phosphotyrosine interaction/phosphotyrosine binding domain and tyrosine phosphorylation sites in polyoma middle T antigen-mediated cell transformation. J Biol Chem. 1997;272:20671–20677. - PubMed
    1. Boyle W J, van der Geer P, Hunter T. Phosphopeptide mapping and phosphoamino acid analysis by two-dimensional separation on thin-layer cellulose plates. Methods Enzymol. 1991;201:110–149. - PubMed
    1. Brown M C, Perrotta J A, Turner C E. Identification of LIM3 as the principal determinant of paxillin focal adhesion localization and characterization of a novel motif on paxillin directing vinculin and focal adhesion kinase binding. J Cell Biol. 1996;135:1109–1123. - PMC - PubMed
    1. Calalb M, Polte T, Hanks S K. Tyrosine phosphorylation of focal adhesion kinase at sites in the catalytic domain regulates kinase activity: a role for the Src family kinases. Mol Cell Biol. 1995;15:954–963. - PMC - PubMed

Publication types

MeSH terms

Substances