. 1998 May;18(5):2804-14.
doi: 10.1128/MCB.18.5.2804.

Two distinct types of repression domain in engrailed: one interacts with the groucho corepressor and is preferentially active on integrated target genes

Affiliations

Two distinct types of repression domain in engrailed: one interacts with the groucho corepressor and is preferentially active on integrated target genes

E N Tolkunova et al. Mol Cell Biol. 1998 May.

Abstract

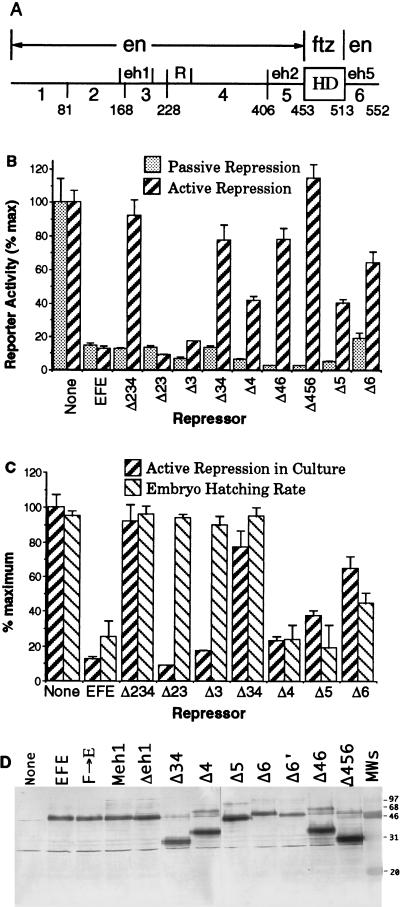
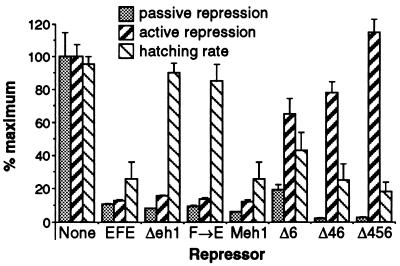
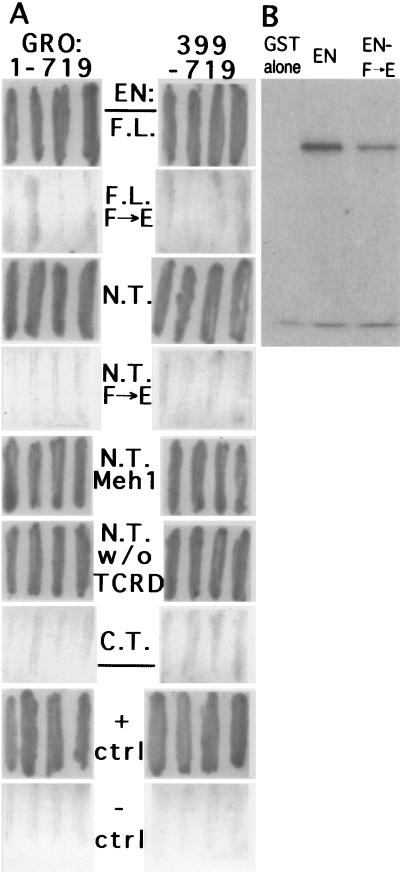
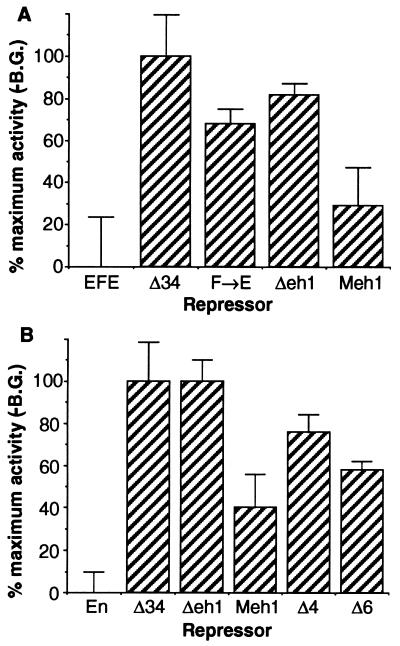
Active transcriptional repression has been characterized as a function of many regulatory factors. It facilitates combinatorial regulation of gene expression by allowing repressors to be dominant over activators under certain conditions. Here, we show that the Engrailed protein uses two distinct mechanisms to repress transcription. One activity is predominant under normal transient transfection assay conditions in cultured cells. A second activity is predominant in an in vivo active repression assay. The domain mediating the in vivo activity (eh1) is highly conserved throughout several classes of homeoproteins and interacts specifically with the Groucho corepressor. While eh1 shows only weak activity in transient transfections, much stronger activity is seen in culture when an integrated target gene is used. In this assay, the relative activities of different repression domains closely parallel those seen in vivo, with eh1 showing the predominant activity. Reducing the amounts of repressor and target gene in a transient transfection assay also increases the sensitivity of the assay to the Groucho interaction domain, albeit to a lesser extent. This suggests that it utilizes rate-limiting components that are relatively low in abundance. Since Groucho itself is abundant in these cells, the results suggest that a limiting component is recruited effectively by the repressor-corepressor complex only on integrated target genes.


Figures

FIG. 1
FIG. 1
Passive activation by F→E in vivo. F→E is a derivative of the EN-FTZ chimera EFE, which carries a single amino acid change in the conserved eh1 repression domain (see text). Passive activation refers to the relief of repression by F→E when it competes with the active repressor EFE for target sites. Transgenic lines were heat pulsed for 6 min at 37°C, between 2 h and 40 min and 2 h and 46 min after the end of a 15-min collection. (a) Recipient strain showing the normal pattern of endogenous ftz gene expression; (b) transgenic embryo carrying a heat-inducible EFE transgene; (c) transgenic embryo carrying both the same EFE transgene and, on a separate chromosome, an inducible transgene encoding the point-mutated derivative EFE-F→E. (a to c) Embryos from each line were heat shocked and stained in parallel for endogenous ftz RNA by in situ hybridization as previously described (32). The probe does not detect the ftz HD sequence contained in the EFE transgenes. Representative embryos from each strain are shown (see text). (d) Hatching rates were determined, cuticles were prepared 28 h later, and the severity of pattern defects was assessed for lines carrying an EFE transgene insert on chromosome III (EFE3), either without or with an EFE-F→E insert on chromosome II (F→E2), or carrying an EFE transgene on the second chromosome (EFE2), either without or with EFE-F→E on the third chromosome (F→E3). Embryos showing a pair-rule pattern of defects in the ventral denticle bands, those showing more severe defects than the pair-rule pattern, and those showing less severe defects were each counted. Very few embryos showed ambiguities between different regions, consistent with pre- vious studies (21) which showed that ftz-dependent pattern elements are deleted preferentially in response to EFE induction, resulting in mostly pair-rule deletions. The percentage of cuticles showing severe (pair-rule or more) defects was multiplied by the fraction that had failed to hatch, and the results are shown as percentages of severe pattern defects. This assumes that all hatched embryos had less severe defects, as previously determined by analyzing hatched larval cuticles (data not shown). Values shown are the averages and ranges from at least two separate experiments with at least 120 embryos per experiment.
FIG. 2
FIG. 2
(A) Features of the EFE chimeric protein. The diagram indicates which portions of the coding sequence derive from EN and which derive from FTZ, our numerical designations of regions of EN (1 to 6 [not including the FTZ HD]), and the locations of known features within those regions (eh1, eh2, eh5, and R). eh1, eh2, and eh5 are peptide sequences found in all known EN homologs (25) from widely divergent species, including insects and mammals; eh1 is also similar to regions of other classes of HD proteins (32), and R is an autonomous active RD identified in cell culture studies (11). Homologies eh2 and eh5 are part of the conserved regions flanking the EN HD, which also include a sequence termed eh3 (immediately flanking the N terminus of the EN HD) that has been implicated in nuclear localization (16a) and thus was left intact in our analyses. Locations of region boundaries in the amino acid sequence are indicated at the bottom. Deletions and other alterations of these regions are described in detail in subsequent figures or in the text. (B) Repression by EFE and derivatives in cultured cells. Drosophila S2 cells were cotransfected with a CAT reporter plasmid, which contains binding sites for both the GR and the FTZ HD, separated by 40 bp, upstream of a basal promoter, and a plasmid that expresses either FTZ or GR (see Materials and Methods for details). Each of the latter two activate reporter expression by 50- to 100-fold above the basal level (shown as 100%). The ability of either EFE or the indicated derivatives to repress this activated transcription was determined by cotransfection of an appropriate expression plasmid. The same amount of a given expression plasmid was used in both repression assays, but the amounts were adjusted among the derivatives to give approximately equal levels of passive repression to allow a more accurate assessment of the potency for active repression. Thus, 4 μg of expression plasmid was used for Δ234, Δ3, and Δ6; 3 μg was used for EFE, Δ23, and Δ34; 1 μg was used for Δ46, Δ456, and Δ5; and 0.5 μg was used for Δ4. The nonrepressed level was determined by cotransfection of 3 μg of empty parental expression plasmid, which is a P-element transformation vector (see Materials and Methods). CAT activities were determined and normalized to the activities of a cotransfected reference gene (see Materials and Methods for details). The graph represents the averages and ranges for at least two independent transfections in at least two separate experiments. (C) Comparison between active repression in culture and hatching rates in vivo in response to EFE derivatives. Active repression was determined as described above, except that the amounts of expression plasmid for Δ4 and Δ5 were the same as that for EFE (3 μg). Hatching rates were determined for the wild-type recipient strain (none) and for transgenic lines expressing the indicated EFE derivatives following induction of expression by a 15-min heat pulse at 37°C between 2.5 and 3 h after egg deposition. Both hatched and unhatched egg casings were counted 28 h after egg deposition (hatching normally occurs at 24 h). Error bars indicate the ranges of values obtained with at least four collection plates (with at least 100 eggs per plate) in at least two separate experiments. Similar results were obtained with at least two independent homozygous insert lines for each derivative. Hatching rates in the absence of induction were higher than 95% for each line. (D) Western blot analysis of proteins from transfected cultures. Nuclear extracts of S2 cell cultures were transiently transfected with expression plasmid for the indicated EFE derivatives followed by PAGE, electroblotting, and immunodetection with polyclonal antiserum to the N-terminal region of EN (antiserum affinity-purified by using regions 1 and 2, which were contained within each of these derivatives). Cultures in 60-mm dishes that were 20% confluent were each transfected with 20 μg of expression plasmid and harvested 60 h later, and nuclear extracts were prepared as previously described (11). See Table 1 footnotes for a description of Δ6′.
FIG. 3
FIG. 3
Mutations in eh1 more strongly affect activity in vivo, while mutating eh5 (in Δ6) has a stronger effect in culture. Passive and active repression by EFE and derivatives and hatching rates of transgenic lines were determined as described in the legend to Fig. 2. In each case, hatching rate is an accurate reflection of the ability to repress endogenous ftz and generate ftz mutant cuticle patterns (see text). Δ6 is a 9-aa deletion, aa 523 to 531, within the conserved region flanking the EN HD (eh5 [Fig. 2A]). Δ4 removes the RD identified by Han and Manley (11), while Δ5 removes the conserved region N terminal to the HD. Note that mutating either regions 4 and 6 together or the three regions that contribute strongly to repression in cultured cells (Δ456) abolishes activity in culture, but not in vivo, whereas mutating eh1 has the converse effect.
FIG. 4
FIG. 4
(A) Interaction of EN and GRO in yeast. Using a two-hybrid system, we tested the abilities of several EN regions to interact with either full-length GRO (aa 1 to 719) or the GRO WD40 repeat region (aa 399 to 719). The EN derivatives used as bait (fused to the GAL4 DBD) are indicated between the panels. F.L., full length (aa 1 to 552); N.T., N-terminal region (aa 1 to 348); F→E, point-mutated derivatives in which the invariant Phe (aa 175) in eh1 was changed to Glu; Meh1, the 15-aa core of the eh1 homology (aa 172 to 186) in the Drosophila protein replaced by the homologous region from the mouse EN1 protein; w/o TCRD (aa 1 to 227), the cell culture RD removed from the N-terminal region; C.T., the C-terminal region of EN (aa 348 to 552); + ctrl, positive control, i.e., mouse p53 as bait interacting with simian virus 40 large T antigen (both sides); − ctrl, negative control, i.e., mouse p53 and GRO (aa 1 to 719 on the left or 399 to 719 on the right). (B) GST-EN interacts with the GRO WD40 repeats in vitro. The EN N-terminal region (aa 1 to 348, without and with the F→E point mutation) fused in frame with GST was produced in E. coli, purified via the GST tag, and mixed with in vitro-translated GRO (aa 399 to 719). Following incubation with glutathione-agarose beads, centrifugation, washing, elution (see Materials and Methods), and SDS-PAGE, interacting proteins were visualized by autoradiography. The lower band present also in the GST alone lane is seen even without programming the system with GRO-encoding DNA (not shown).
FIG. 5
FIG. 5
Repression of integrated target genes in cultured Drosophila cells. A pool of S2 cells stably transfected with the same CAT-expressing reporter used in Fig. 2 and 3 (selected on 200 μg of hygromycin B per ml after cotransfection of reporter with the hygromycin-resistant gene expression plasmid pCop-hygro) were transiently transfected with the activator expression plasmid encoding GR (see Materials and Methods), either alone or with the indicated repressor expression plasmids. Parallel transfections with empty expression vector were used to determine the background of expression without activation, which was subtracted from the results shown. This background (B.G.) amounted to 50 to 80% of the maximum activity, which is the activity with GR alone. (A) EFE and derivatives (with the FTZ HD) were transfected in parallel cultures. Each received 0.1 μg of GR plasmid, 5 μg of the indicated repressor expression plasmid, and 0.5 ng of the reference gene. Values given were normalized to the amount of CAT activity (divided by reference gene activity) with activator, but with empty repressor expression vector (pCaSpeR-hs), which is shown as 100%. The averages and ranges of two independent transfections are shown. Similar results were obtained for four additional independent transfections in two separate experiments. (B) EN and derivatives (with the EN HD) were transfected in parallel cultures as described for panel A, and expression levels were normalized to the level with activator alone, as in panel A. Similar results were obtained in four additional independent transfections in two separate experiments, each with a different pool of stably transfected S2 cells.
FIG. 6
FIG. 6
Transient transfections with low amounts of reporter and repressor plasmids. S2 cells were transfected as described in the legend to Fig. 2, except that reporter plasmid was reduced by 4-fold to 0.5 μg per 60-mm culture dish, activator plasmid was reduced by 5-fold to 8 ng, and repressor expression plasmids (for EN and EN derivatives) were 12-fold lower (0.4 μg). Total DNA was reduced by 2-fold to 5 μg per dish. The averages and ranges of two independent transfections for each plasmid, normalized to the activity of a cotransfected reference gene and to the activated level without repressor (shown as 100%, corresponding to 18-fold activation above the nonactivated level), are shown. Similar results were obtained in four independent transfections in two additional experiments, one using 0.2 μg of each repressor expression plasmid.

References

    1. Aronson B D, Fisher A L, Blechman K, Caudy M, Gergen J P. Groucho-dependent and -independent repression activities of Runt domain proteins. Mol Cell Biol. 1997;17:5581–5587. - PMC - PubMed
    1. Biggin M D, Tjian R. A purified Drosophila homeodomain protein represses transcription in vitro. Cell. 1989;58:433–440. - PubMed
    1. Desplan C, Theis J, O’Farrell P H. The sequence specificity of homeodomain-DNA interaction. Cell. 1988;54:1081–90. - PMC - PubMed
    1. Dimitri P, Pisano C. Position effect variegation in Drosophila melanogaster: Relationship between suppression effect and the amount of Y chromosome. Genetics. 1989;122:793–800. - PMC - PubMed
    1. Dorsett D, Viglianti G A, Rutledge B J, Meselson M. Alteration of hsp82 gene expression by the gypsy transposon and suppressor genes in Drosophila melanogaster. Genes Dev. 1989;3:454–468. - PubMed

Publication types

MeSH terms

LinkOut - more resources