. 1998 May;18(5):2855-66.
doi: 10.1128/MCB.18.5.2855.

Genetic evidence of a role for Lck in T-cell receptor function independent or downstream of ZAP-70/Syk protein tyrosine kinases

Affiliations

Genetic evidence of a role for Lck in T-cell receptor function independent or downstream of ZAP-70/Syk protein tyrosine kinases

J Wong et al. Mol Cell Biol. 1998 May.

Abstract

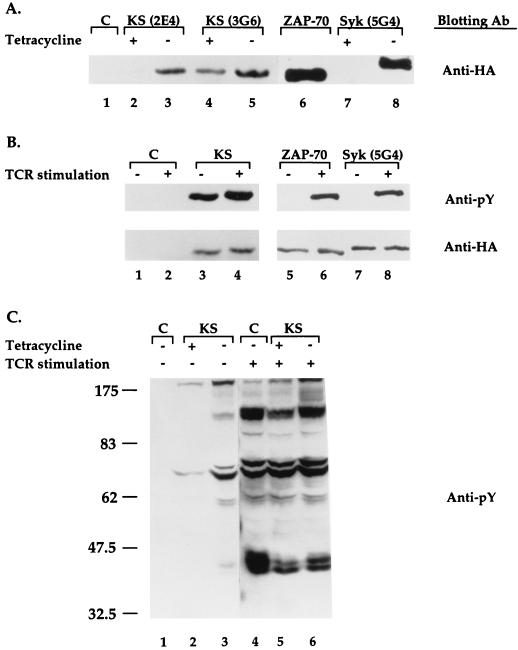
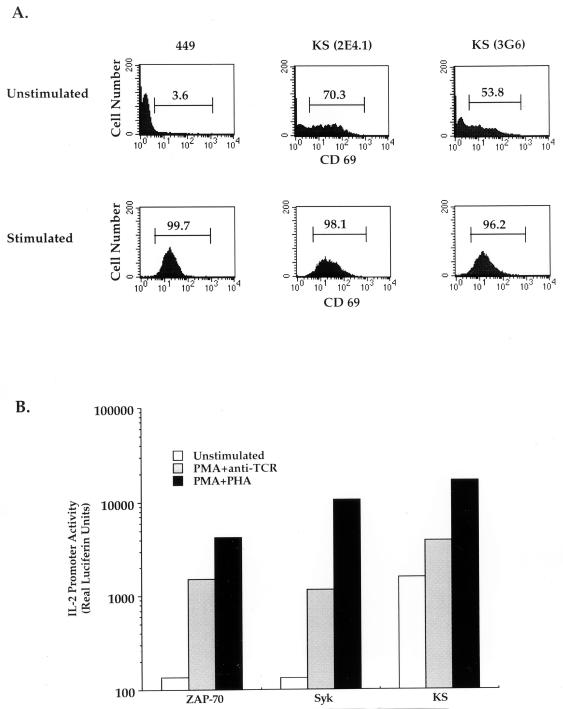
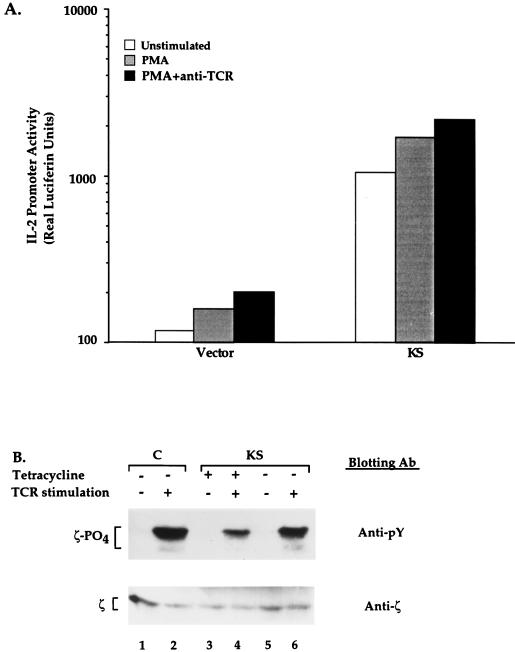
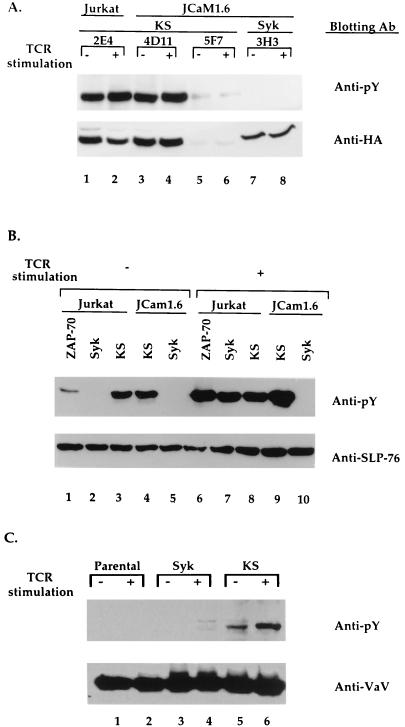
T-cell antigen receptor (TCR) engagement results in sequential activation of the Src protein tyrosine kinases (PTKs) Lck and Fyn and the Syk PTKs, ZAP-70 and Syk. While the Src PTKs mediate the phosphorylation of TCR-associated signaling subunits and the phosphorylation and activation of the Syk PTKs, the lack of a constitutively active Syk PTK has prohibited the analysis of Lck function downstream of these initiating signaling events. We describe here the generation of an activated Syk family PTK by substituting the kinase domain of Syk for the homologous region in ZAP-70 (designated as KS for kinase swap). Expression of the KS chimera resulted in its autophosphorylation, the phosphorylation of cellular proteins, the upregulation of T-cell activation markers, and the induction of interleukin-2 gene synthesis in a TCR-independent fashion. The KS chimera and downstream ZAP-70 or Syk substrates, such as SLP-76, were still phosphorylated when expressed in Lck-deficient JCaM1.6 T cells. However, expression of the KS chimera in JCaM1.6 cells failed to rescue downstream signaling events, demonstrating a functional role for Lck beyond the activation of the ZAP-70 and Syk PTKs. These results indicate that downstream TCR signaling pathways may be differentially regulated by ZAP-70 and Lck PTKs and provide a mechanism by which effector functions may be selectively activated in response to TCR stimulation.


Figures

FIG. 1
FIG. 1
Expression of PTKs in HeLa cells. (A) Schematic representation of chimeric PTKs. Chimeras of ZAP-70 and Syk PTKs were generated by PCR-directed mutagenesis. Three chimeric PTKs, KS, H, and TAD, were generated by exchange of the kinase domains, the hinge regions, and the transactivation domains, respectively. (B) Autophosphorylation of the KS chimera. HeLa cells were infected with recombinant vaccinia virus encoding the chimeric and wild-type PTKs individually as described in Materials and Methods. Cells (2 × 10⁵) were lysed, and lysates were used for immunoprecipitation or immunoblotting studies with an anti-pY MAb (top panel) and anti-ZAP-70 or anti-Syk antiserum (bottom panel). Lanes: 1, wild-type (WT) ZAP-70; 2, TAD chimera; 3, KS chimera; 4, wild-type Syk; 5, H chimera. To ensure that equimolar amounts of each of the PTKs were analyzed, expression of each of the wild-type and chimeric PTKs was determined by blotting with anti-ZAP-70 or anti-Syk antibodies and normalized to standardized amounts of baculovirus-encoded GST–ZAP-70 or GST-Syk protein (data not shown) (6, 10). No differences between tagged and untagged versions of Syk were observed (data not shown). The experiment shown here is representative of five independent experiments. Molecular weight standards (in thousands) are depicted at the left margin. (C) Autoactivation and phosphorylation of HeLa cell proteins by the KS chimera. HeLa cell lysates infected with chimeric or wild-type PTK as described in for panel B were analyzed for tyrosine phosphorylation of cellular proteins. MW, molecular weight standards. (D) The tyrosine residues within the transactivation loop contribute to, but are not absolutely required for, autoactivation and autophosphorylation. HeLa cells (2 × 10⁵) were infected with wild-type Syk (lanes 1), the KS chimera (lanes 2), or the KS chimera in which Tyr 518 and Tyr 519 in Syk were mutated to phenylalanine [KS(YYFF)] (lanes 3). Anti-HA immunoprecipitates of each PTK were analyzed in an in vitro kinase assay using an exogenous substrate (top panel) and immunoblotting with an anti-pY MAb (third panel from top). Coomassie blue staining demonstrates comparable levels of the GST-band III exogenous substrate (second panel from top), and immunoblotting analysis with an anti-HA MAb demonstrates comparable levels of the expressed PTK (bottom panel).
FIG. 2
FIG. 2
Biochemical analysis of cells expressing the KS chimera. (A) Expression of KS, Syk, and ZAP-70. Stable transfectants of the KS chimera (2E4 and 3G6) and Syk (5G4) were expressed under the control of a tetracycline-regulated promoter in Jurkat cells (lanes 2 to 5, 7, and 8) (37). In addition, ZAP-70 was overexpressed under the control of an actin promoter (lane 6) (38). Parental Jurkat 449 cells are included as a control (C) (lane 1). Expression of the HA-epitope-tagged PTKs was analyzed by Western blotting. Since the KS chimera was expressed at approximately one-third the level of wild-type ZAP-70 or Syk, immunoprecipitates from 4 × 10⁷ cells of the KS-expressing clones (lanes 2 to 5) were analyzed, compared to 2 × 10⁷ cells expressing HA-Syk or HA–ZAP-70 (lanes 6 to 8). Expression of the KS chimera was maximal at 24 h following tetracycline withdrawal and did not change for the 72-h period of analysis (data not shown). Lanes: 1, parental cells (449); 2; KS clone 2E4 with tetracycline (nonpermissive conditions); 3, KS clone 2E4 without tetracycline (permissive conditions); 4, KS clone 3G6, nonpermissive conditions; 5, KS clone 3G6, permissive conditions; 6, ZAP-70 (wt24); 7, Syk clone 5G4, nonpermissive conditions; 8, Syk clone 5G4, permissive conditions. (B) Phosphorylation of KS in T cells. The epitope-tagged KS (clone 2E4; 4 × 10⁷ cells), wild-type ZAP-70 (clone wt24; 107 cells), and wild-type Syk (clone 5G4; 107 cells) were immunoprecipitated in resting or TCR-activated cells and analyzed by Western blotting with an anti-pY MAb (top) or an anti-HA MAb (bottom). Both KS- and Syk-expressing clones were analyzed under permissive conditions. These data are representative of three independent experiments. (C) Tyrosine phosphorylation of cellular proteins by the KS chimera. Lysates (5 × 10⁶ cells/lane) from stable transfectants were analyzed by immunoblotting with an anti-pY MAb. Lanes: 1, control (C) Jurkat cells (449); 2, KS cells (clone 2E4) under nonpermissive conditions; 3, KS cells (clone 2E4) under nonpermissive conditions; 4, control parental Jurkat cells (449); 5, KS cells (clone 2E4) under permissive conditions; 6, KS cells (clone 2E4) under permissive conditions. Lanes 1 to 3 represent resting cells, while lanes 4 to 6 represent cells stimulated with an anti-CD3 MAb (235) for 2 min at 37°C. All lanes were derived from the same gel and exposure, although the molecular weight markers originally placed between lanes 3 and 4 were cropped from the final photograph. These data are representative of three independent experiments and of three independent clones expressing the KS chimera. (D) Tyrosine phosphorylation of SLP-76, an in vivo downstream substrate of ZAP-70. SLP-76 was immunoprecipitated from control (C) parental cells (clone 449; 2 × 10⁷ cells/lane) (lanes 1 and 2) or KS cells (clone 2E4; 2 × 10⁷ cells/lane) (lanes 3 and 4) and analyzed by Western blotting with an anti-pY MAb (top panel) or an anti-SLP-76 MAb (H3 MAb) (bottom panel). Unstimulated cells are represented in lanes 1 and 3, while TCR-activated cells are represented in lanes 2 and 4. These data are representative of a minimum of three independent experiments and of two independent clones expressing the KS chimera. (E) Tyrosine phosphorylation of Vav. Vav was immunoprecipitated from control (C) parental 449 cells (2 × 10⁷ cells/lane) (lanes 1 and 2) or KS cells (clone 2E4; 2 × 10⁷ cells/lane) (lanes 3 and 4) and analyzed by Western blotting with an anti-pY MAb (top panel) or an anti-Vav MAb (bottom panel). Unstimulated cells are represented in lanes 1 and 3, while TCR-activated cells are represented in lanes 2 and 4. These data are representative of a minimum of three independent experiments and of two independent clones expressing the KS chimera.
FIG. 2
FIG. 2
Biochemical analysis of cells expressing the KS chimera. (A) Expression of KS, Syk, and ZAP-70. Stable transfectants of the KS chimera (2E4 and 3G6) and Syk (5G4) were expressed under the control of a tetracycline-regulated promoter in Jurkat cells (lanes 2 to 5, 7, and 8) (37). In addition, ZAP-70 was overexpressed under the control of an actin promoter (lane 6) (38). Parental Jurkat 449 cells are included as a control (C) (lane 1). Expression of the HA-epitope-tagged PTKs was analyzed by Western blotting. Since the KS chimera was expressed at approximately one-third the level of wild-type ZAP-70 or Syk, immunoprecipitates from 4 × 10⁷ cells of the KS-expressing clones (lanes 2 to 5) were analyzed, compared to 2 × 10⁷ cells expressing HA-Syk or HA–ZAP-70 (lanes 6 to 8). Expression of the KS chimera was maximal at 24 h following tetracycline withdrawal and did not change for the 72-h period of analysis (data not shown). Lanes: 1, parental cells (449); 2; KS clone 2E4 with tetracycline (nonpermissive conditions); 3, KS clone 2E4 without tetracycline (permissive conditions); 4, KS clone 3G6, nonpermissive conditions; 5, KS clone 3G6, permissive conditions; 6, ZAP-70 (wt24); 7, Syk clone 5G4, nonpermissive conditions; 8, Syk clone 5G4, permissive conditions. (B) Phosphorylation of KS in T cells. The epitope-tagged KS (clone 2E4; 4 × 10⁷ cells), wild-type ZAP-70 (clone wt24; 107 cells), and wild-type Syk (clone 5G4; 107 cells) were immunoprecipitated in resting or TCR-activated cells and analyzed by Western blotting with an anti-pY MAb (top) or an anti-HA MAb (bottom). Both KS- and Syk-expressing clones were analyzed under permissive conditions. These data are representative of three independent experiments. (C) Tyrosine phosphorylation of cellular proteins by the KS chimera. Lysates (5 × 10⁶ cells/lane) from stable transfectants were analyzed by immunoblotting with an anti-pY MAb. Lanes: 1, control (C) Jurkat cells (449); 2, KS cells (clone 2E4) under nonpermissive conditions; 3, KS cells (clone 2E4) under nonpermissive conditions; 4, control parental Jurkat cells (449); 5, KS cells (clone 2E4) under permissive conditions; 6, KS cells (clone 2E4) under permissive conditions. Lanes 1 to 3 represent resting cells, while lanes 4 to 6 represent cells stimulated with an anti-CD3 MAb (235) for 2 min at 37°C. All lanes were derived from the same gel and exposure, although the molecular weight markers originally placed between lanes 3 and 4 were cropped from the final photograph. These data are representative of three independent experiments and of three independent clones expressing the KS chimera. (D) Tyrosine phosphorylation of SLP-76, an in vivo downstream substrate of ZAP-70. SLP-76 was immunoprecipitated from control (C) parental cells (clone 449; 2 × 10⁷ cells/lane) (lanes 1 and 2) or KS cells (clone 2E4; 2 × 10⁷ cells/lane) (lanes 3 and 4) and analyzed by Western blotting with an anti-pY MAb (top panel) or an anti-SLP-76 MAb (H3 MAb) (bottom panel). Unstimulated cells are represented in lanes 1 and 3, while TCR-activated cells are represented in lanes 2 and 4. These data are representative of a minimum of three independent experiments and of two independent clones expressing the KS chimera. (E) Tyrosine phosphorylation of Vav. Vav was immunoprecipitated from control (C) parental 449 cells (2 × 10⁷ cells/lane) (lanes 1 and 2) or KS cells (clone 2E4; 2 × 10⁷ cells/lane) (lanes 3 and 4) and analyzed by Western blotting with an anti-pY MAb (top panel) or an anti-Vav MAb (bottom panel). Unstimulated cells are represented in lanes 1 and 3, while TCR-activated cells are represented in lanes 2 and 4. These data are representative of a minimum of three independent experiments and of two independent clones expressing the KS chimera.
FIG. 3
FIG. 3
Functional analysis of cells expressing the KS chimera. (A) Upregulation of CD69, an early TCR activation marker, by the KS chimera. Cells expressing the KS chimera (clones 2E4.1 and 3G6) were analyzed for CD69 expression by FACS analysis. Parental 449 T cells are also shown (left panels). A total of 106 cells were analyzed under each set of experimental conditions. The top panels represent resting cells examined under permissive conditions. The bottom panels represent cells examined following stimulation with PMA. These data are representative of five independent experiments. (B) Receptor-independent IL-2 gene synthesis in cells expressing the KS chimera. Jurkat T cells were transiently transfected with wild-type or chimeric PTKs and a reporter plasmid encoding the IL-2 promoter. Cells were harvested after 36 h and replated in medium alone, medium containing PMA and an anti-TCR MAb (235), or medium containing PMA and PHA. Luciferase activity was assessed following 6 h of stimulation and normalized for CAT activity as previously described (62). The experiment shown here is representative of at least five independent experiments. Similar results were obtained for stable clones.
FIG. 4
FIG. 4
Constitutive activation of T cells by the KS chimera does not require a surface TCR complex. (A) IL-2 gene synthesis induced by the KS chimera does not require a surface TCR. The KS chimera was transiently transfected into a TCR-negative variant of the Jurkat cell line with an IL-2–luciferase construct. Cells were analyzed as described in the legend to Fig. 3B. Luciferase activity induced by PMA and ionomycin was comparable to the level induced in TCR-positive T cells (Fig. 3B). These data are representative of two independent experiments. (B) The TCR ζ chain is not tyrosine phosphorylated by the KS chimera. The TCR ζ chain was immunoprecipitated from 4 × 10⁷ parental Jurkat cells (C) (lanes 1 and 2), from KS-expressing cells under nonpermissive conditions (clone 2E4) (lanes 3 and 4), and from KS-expressing cells under permissive conditions (clone 2E4) (lanes 5 and 6). Immunoprecipitates from 4 × 10⁷ resting (lanes 1, 3, and 5) or TCR-stimulated (lanes 2, 4, and 6) cells were analyzed by immunoblotting with an anti-pY MAb (top panel) or an anti-ζ antiserum (bottom panel). These data are representative of two independent experiments.
FIG. 5
FIG. 5
Functional evidence for Lck acting downstream or independently of ZAP-70 activation. (A) Tyrosine phosphorylation of the KS chimera is receptor and Lck independent. Immunoprecipitates of KS (lanes 1 to 6) or wild-type Syk (lanes 7 and 8) from Jurkat cells (clone 2E4) (lanes 1 and 2) or JCaM1.6 cells (clones 4D11, 5F7, and 3H3) (lanes 3 to 8) were analyzed by immunoblotting with an antiphosphotyrosine MAb (top) or an anti-HA MAb (bottom). A total of 4 × 10⁷ cells were analyzed per immunoprecipitate. The JCaM1.6 clones were expressed under the control of the actin promoter. The 2E4 clone was examined under permissive conditions. (B) Tyrosine phosphorylation of SLP-76 by the KS chimera is receptor and Lck independent. Immunoprecipitates of SLP-76 from Jurkat cells (lanes 1 to 3 and 6 to 8) or JCaM1.6 cells (lanes 4, 5, 9, and 10) expressing the KS chimera (clone 2E4 [lanes 3 and 8] and clone 4D11 [lanes 4 and 9]), wild-type Syk (clone 5G4 [lanes 2 and 7]) and clone 3H3, [lanes 5 and 10]), or wild-type ZAP-70 (clone wt24 [lanes 1 and 6]) were analyzed by immunoblotting with an anti-pY MAb (top panel) or an anti-SLP-76 (H3) MAb (bottom panel). A total of 2 × 10⁷ cells were analyzed per immunoprecipitate. Clones 5F4 and 2E4 were analyzed under permissive conditions. These data are representative of four independent experiments. (C) Tyrosine phosphorylation of Vav by the KS chimera. Immunoprecipitates of Vav from JCaM1.6 cells (lanes 1 and 2), JCaM1.6 cells expressing Syk (clone 5G4) (lanes 3 and 4), or JCaM1.6 cells expressing the KS chimera (clone 4D11) (lanes 5 and 6) were analyzed by immunoblotting with an anti-pY MAb (top panel) or an anti-Vav MAb (bottom panel). A total of 2 × 10⁷ cells were analyzed per immunoprecipitate. These data are representative of two independent experiments. On substantially longer exposures, two minor nonspecific bands migrating above and below Vav were observed in lanes 4 and 5. (D) Lck is required downstream of ZAP-70 activation for CD69 expression. JCaM1.6 cells, Jurkat cells expressing the KS chimera (clone 2E4), or JCaM1.6 cells expressing the KS chimera (clones 4D11 and 7E7) were analyzed for CD69 expression as described in the legend to Fig. 3A. A total of 106 cells were analyzed under each set of experimental conditions. The top panels represent resting cells, while the bottom panels represent cells examined following treatment with PMA as described in Materials and Methods. The percentage of CD69+ cells is quantitated above each bracket. These data are representative of three independent experiments. (E) Lck is required downstream of ZAP-70 activation for IL-2 gene synthesis. Wild-type and chimeric PTKs were individually transiently transfected with an IL-2 promoter into the Lck-deficient variant Jurkat T-cell line JCaM1.6. Luciferase activity was detected in unstimulated and TCR-activated cells as described in Materials and Methods. A parallel experiment was performed in parental Jurkat cells for comparison purposes. These data are representative of at least three independent experiments.
FIG. 5
FIG. 5
Functional evidence for Lck acting downstream or independently of ZAP-70 activation. (A) Tyrosine phosphorylation of the KS chimera is receptor and Lck independent. Immunoprecipitates of KS (lanes 1 to 6) or wild-type Syk (lanes 7 and 8) from Jurkat cells (clone 2E4) (lanes 1 and 2) or JCaM1.6 cells (clones 4D11, 5F7, and 3H3) (lanes 3 to 8) were analyzed by immunoblotting with an antiphosphotyrosine MAb (top) or an anti-HA MAb (bottom). A total of 4 × 10⁷ cells were analyzed per immunoprecipitate. The JCaM1.6 clones were expressed under the control of the actin promoter. The 2E4 clone was examined under permissive conditions. (B) Tyrosine phosphorylation of SLP-76 by the KS chimera is receptor and Lck independent. Immunoprecipitates of SLP-76 from Jurkat cells (lanes 1 to 3 and 6 to 8) or JCaM1.6 cells (lanes 4, 5, 9, and 10) expressing the KS chimera (clone 2E4 [lanes 3 and 8] and clone 4D11 [lanes 4 and 9]), wild-type Syk (clone 5G4 [lanes 2 and 7]) and clone 3H3, [lanes 5 and 10]), or wild-type ZAP-70 (clone wt24 [lanes 1 and 6]) were analyzed by immunoblotting with an anti-pY MAb (top panel) or an anti-SLP-76 (H3) MAb (bottom panel). A total of 2 × 10⁷ cells were analyzed per immunoprecipitate. Clones 5F4 and 2E4 were analyzed under permissive conditions. These data are representative of four independent experiments. (C) Tyrosine phosphorylation of Vav by the KS chimera. Immunoprecipitates of Vav from JCaM1.6 cells (lanes 1 and 2), JCaM1.6 cells expressing Syk (clone 5G4) (lanes 3 and 4), or JCaM1.6 cells expressing the KS chimera (clone 4D11) (lanes 5 and 6) were analyzed by immunoblotting with an anti-pY MAb (top panel) or an anti-Vav MAb (bottom panel). A total of 2 × 10⁷ cells were analyzed per immunoprecipitate. These data are representative of two independent experiments. On substantially longer exposures, two minor nonspecific bands migrating above and below Vav were observed in lanes 4 and 5. (D) Lck is required downstream of ZAP-70 activation for CD69 expression. JCaM1.6 cells, Jurkat cells expressing the KS chimera (clone 2E4), or JCaM1.6 cells expressing the KS chimera (clones 4D11 and 7E7) were analyzed for CD69 expression as described in the legend to Fig. 3A. A total of 106 cells were analyzed under each set of experimental conditions. The top panels represent resting cells, while the bottom panels represent cells examined following treatment with PMA as described in Materials and Methods. The percentage of CD69+ cells is quantitated above each bracket. These data are representative of three independent experiments. (E) Lck is required downstream of ZAP-70 activation for IL-2 gene synthesis. Wild-type and chimeric PTKs were individually transiently transfected with an IL-2 promoter into the Lck-deficient variant Jurkat T-cell line JCaM1.6. Luciferase activity was detected in unstimulated and TCR-activated cells as described in Materials and Methods. A parallel experiment was performed in parental Jurkat cells for comparison purposes. These data are representative of at least three independent experiments.

Similar articles

Cited by

References

    1. Amrein K E, Panholzer B, Flint N A, Bannwarth W, Burn P. The Src homology 2 domain of the protein-tyrosine kinase p56lck mediates both intermolecular and intramolecular interactions. Proc Natl Acad Sci USA. 1993;90:10285–10289. - PMC - PubMed
    1. Arpaia E, Shahar M, Dadi H, Cohen A, Roifman C. Defective T cell receptor signaling and CD8+ thymic selection in humans lacking ZAP-70 kinase. Cell. 1994;76:947–958. - PubMed
    1. August A, Dupont B. Activation of src family kinase Lck following CD28 crosslinking in the Jurkat leukemic cell line. Biochem Biophys Res Commun. 1994;199:1466–1473. - PubMed
    1. Boussiotis V A, Barber D L, Lee B J, Gribben J G, Freeman G J, Nadler L M. Differential association of protein tyrosine kinases with the T cell receptor is linked to induction of anergy and its prevention by B7 family-mediated costimulation. J Exp Med. 1996;184:365–376. - PMC - PubMed
    1. Briggs S D, Bryant S S, Jove R, Sanderson S D, Smithgall T E. The ras GTPase-activating protein (GAP) is an SH3 domain-binding protein and substrate for the Src-related tyrosine kinase, Hck. J Biol Chem. 1995;270:14718–14724. - PubMed

Publication types

MeSH terms

Substances