. 1998 May;18(5):3059-68.
doi: 10.1128/MCB.18.5.3059.

Laron dwarfism and non-insulin-dependent diabetes mellitus in the Hnf-1alpha knockout mouse

Affiliations

Laron dwarfism and non-insulin-dependent diabetes mellitus in the Hnf-1alpha knockout mouse

Y H Lee et al. Mol Cell Biol. 1998 May.

Abstract

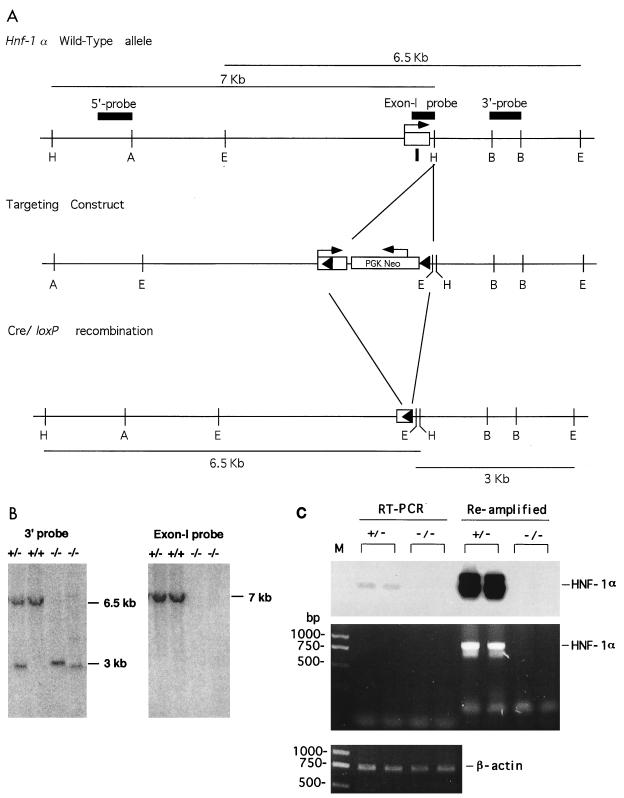
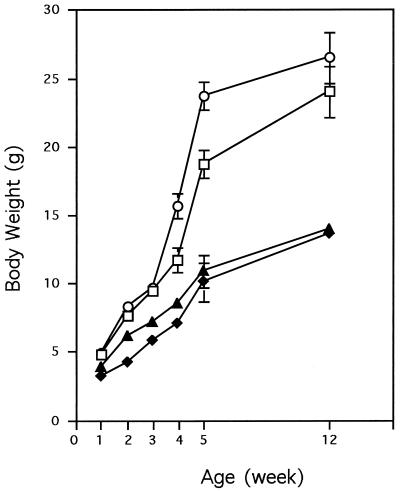
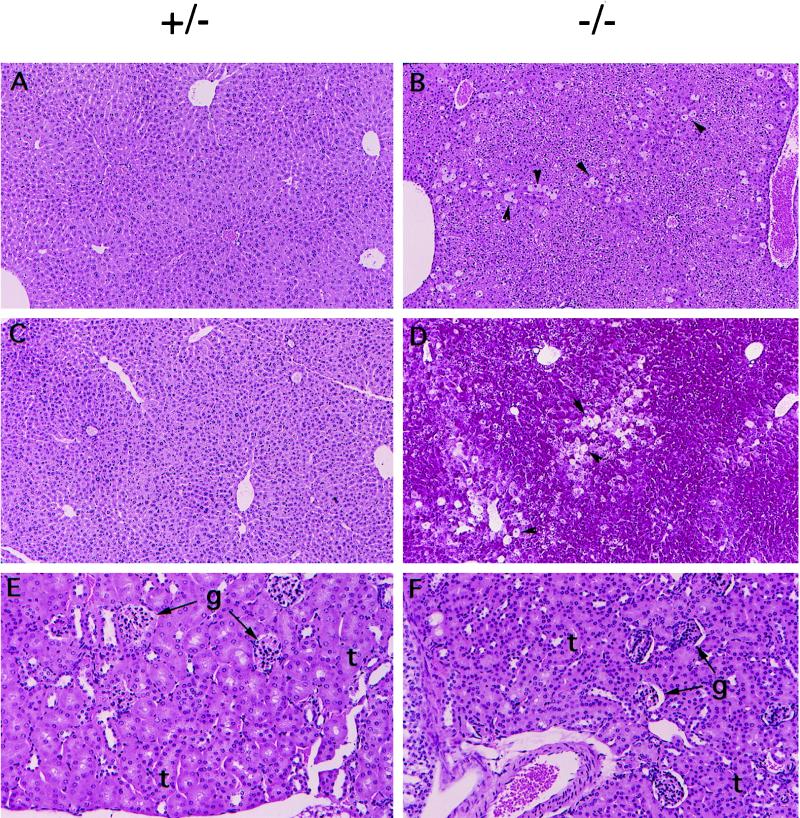
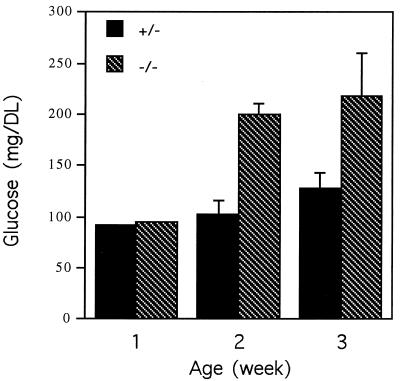
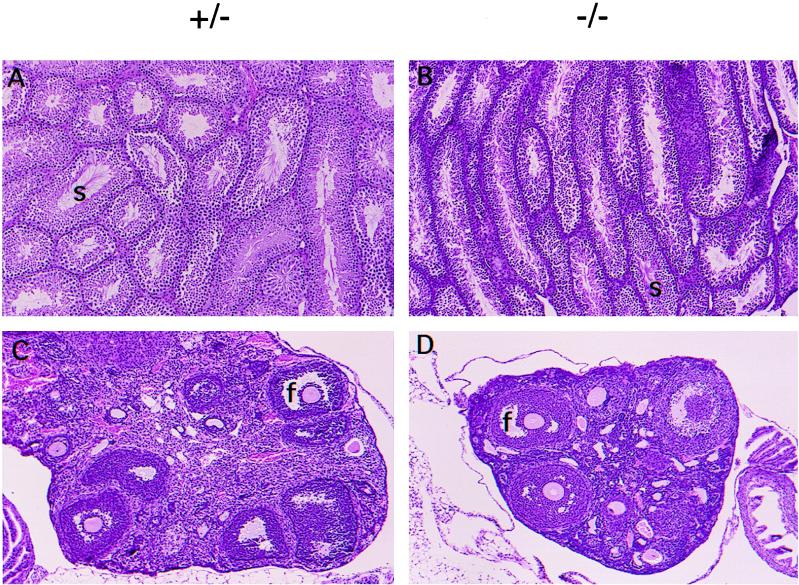
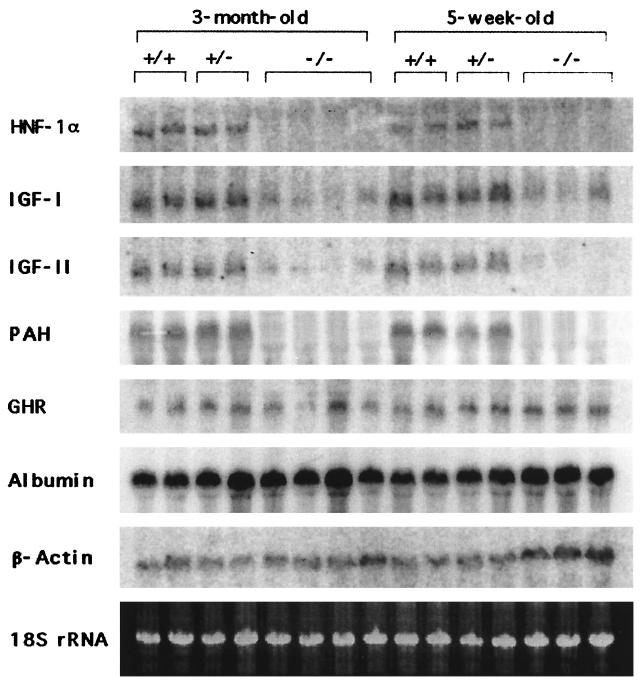
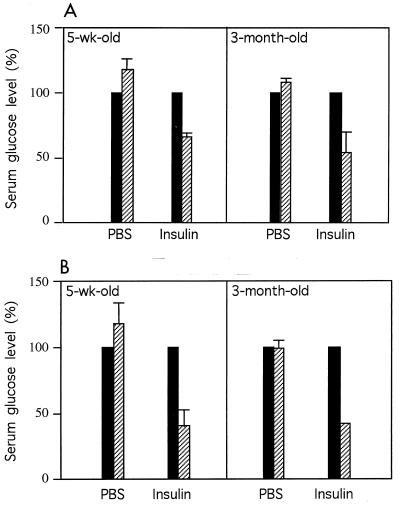
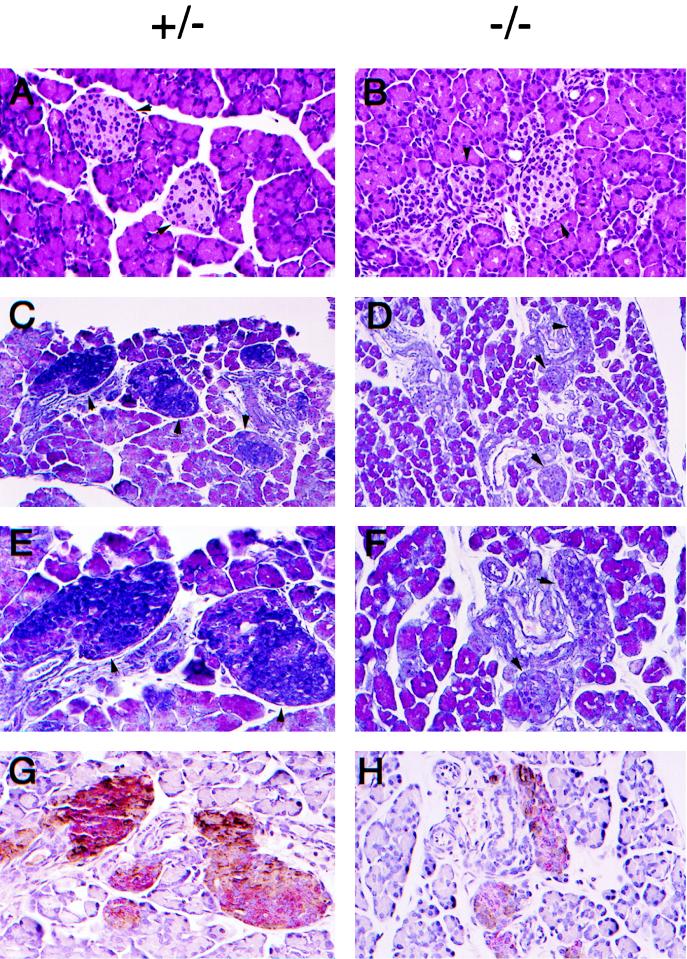
Mice deficient in hepatocyte nuclear factor 1 alpha (HNF-1alpha) were produced by use of the Cre-loxP recombination system. HNF-1alpha-null mice are viable but sterile and exhibit a phenotype reminiscent of both Laron-type dwarfism and non-insulin-dependent diabetes mellitus (NIDDM). In contrast to an earlier HNF-1alpha-null mouse line that had been produced by use of standard gene disruption methodology (M. Pontoglio, J. Barra, M. Hadchouel, A. Doyen, C. Kress, J. P. Bach, C. Babinet, and M. Yaniv, Cell 84:575-585, 1996), these mice exhibited no increased mortality and only minimal renal dysfunction during the first 6 months of development. Both dwarfism and NIDDM are most likely due to the loss of expression of insulin-like growth factor I (IGF-I) and lower levels of insulin, resulting in stunted growth and elevated serum glucose levels, respectively. These results confirm the functional significance of the HNF-1alpha regulatory elements that had previously been shown to reside in the promoter regions of both the IGF-I and the insulin genes.


Figures

FIG. 1
FIG. 1
Targeted modification of the Hnf-1α gene locus. (A) Hnf-1α gene (top), targeted allele (middle), and schematic of the expected Cre-loxP-mediated deletion of the Hnf-1α gene (bottom). Filled triangles are loxP sites, and arrows show the direction of transcription. The restriction sites are as follows: A, AvrII; B, BamHI; E, EcoRI; H, HindIII; S, SalI. (B) Results of Southern blot analysis of representative F3 mouse tail biopsies. Tail DNA was digested with EcoRI and probed with the 1.0-kb 3′ probe or the first exon probe indicated in panel A. The sizes of the expected bands are shown for DNA from a wild-type allele (+) or a Cre-mediated deleted allele (−). (C) Results of RT-PCR analysis of HNF-1α mRNA in the kidneys of HNF-1α-null mice. The middle and bottom panels show the RT-PCR products for HNF-1α and β-actin mRNAs, respectively, in ethidium bromide-stained agarose gels. The top panel shows the result of probing DNA in the middle panel with a 32P-labeled oligonucleotide derived from the HNF-1α coding region. M, DNA molecular size marker.
FIG. 2
FIG. 2
Growth curves for HNF-1α-null mice. The value for each point is the average body weight of three to five mice of the same genotype. The standard deviation for each group is shown as a vertical line. Symbols: ○, +/−, male; □, +/−, female; ▴, −/−, male; ⧫, −/−, female.
FIG. 3
FIG. 3
Histological sections of liver and kidneys from 3-month-old HNF-1α-null mice. (A and B) Hematoxylin-eosin-stained liver sections. The arrowheads show representative degenerating hepatocytes. Original magnification, ×100. (C and D) Periodic acid-Schiff-stained liver sections. The arrows show representative degenerating hepatocytes. Original magnification, ×100. (E and F) Hematoxylin-eosin-stained kidney sections. Original magnification, ×200. g, glomeruli. t, tubules.
FIG. 4
FIG. 4
Serum glucose levels in HNF-1α-null mice during development. The value for each group is the average for at least three serum samples. The standard deviation for each group is shown as a vertical line.
FIG. 5
FIG. 5
Histological sections of ovaries and testes from 3-month old HNF-1α-null mice. (A and B) Hematoxylin-eosin-stained testis sections. s, sperm. Original magnification, ×100. (C and D) Hematoxylin-eosin-stained ovary sections. f, follicle. Original magnification, ×100.
FIG. 6
FIG. 6
Inactivation of HNF-1α abolishes liver IGF-I and IGF-II mRNA levels. Northern blotting analysis of representative liver biopsies of Hnf-1α−/− mice is shown. Liver total RNAs (15 μg) from 5-week-old and 3-month-old Hnf-1α−/− mice were denatured and electrophoresed on a formaldehyde-containing 1% agarose gel, blotted to nylon membranes, and probed with the indicated cDNA and oligonucleotide probes. Each lane contains RNA from an individual animal.
FIG. 7
FIG. 7
HNF-1α-null mice are not resistant to insulin treatment. Hnf-1α+/− mice (A) and Hnf-1α−/− mice (B) were administered phosphate-buffered saline (PBS) or insulin solution intraperitoneally at a dosage of 2 mU/mg of body weight/10 μl. Before (▪) and 30 min after (▨) insulin administration, 3 μl of blood was taken from the tail vein of each animal and monitored for glucose concentration. The pretreatment glucose level was designated 100%. After treatment, the glucose level was calculated as a percentage of the pretreatment level. The value for each group is the average for the three serum samples. The standard deviation for each group is shown as a vertical line.
FIG. 8
FIG. 8
Reduced expression of insulin peptide in the pancreatic β cells of HNF-1α-null mice. Histological sections of pancreas from 10-day-old HNF-1α-null mice are shown. (A and B) Hematoxylin-eosin-stained pancreas sections. The arrowheads show representative islet of Langerhans cells. Original magnification, ×200. (C to F) Gomeri chrome alum-hematoxylin-phloxine-stained pancreas sections. Original magnifications, ×200 for C and D and ×400 for E and F. (G and H) Double immunostaining for insulin and glucagon. Formalin-fixed paraffin-embedded pancreas sections were stained with monoclonal antibody to insulin (alkaline phosphatase method labeled and red) and monoclonal antibody to glucagon (peroxidase-diaminobenzidine method labeled and brown). Original magnification, ×400. Different sections of the same islet of Langerhans cells of each genotype are shown in panels E and G and panels F and H.

References

    1. Aden D P, Fogel A, Plotkin S, Damjanov I, Knowles B B. Controlled synthesis of HBsAg in a differentiated human liver carcinoma-derived cell line. Nature. 1979;282:615–616. - PubMed
    1. Artelt P, Grannemann R, Stocking C, Friel J, Bartsch J, Hauser H. The prokaryotic neomycin-resistance-encoding gene acts as a transcriptional silencer in eukaryotic cells. Gene. 1991;99:249–254. - PubMed
    1. Baker J, Hardy M P, Zhou J, Bondy C, Lupu F, Bellve A R, Efstratiadis A. Effects of an Igf1 gene null mutation on mouse reproduction. Mol Endocrinol. 1996;10:903–918. - PubMed
    1. Baumhueter S, Mendel D B, Conley P B, Kuo C J, Turk C, Graves M K, Edwards C A, Courtois G, Crabtree G R. HNF-1 shares three sequence motifs with the POU domain proteins and is identical to LF-B1 and APF. Genes Dev. 1990;4:372–379. - PubMed
    1. Blumenfeld M, Maury M, Chouard T, Yaniv M, Condamine H. Hepatic nuclear factor 1 (HNF 1) shows a wider distribution than products of its known target genes in developing mouse. Development. 1991;113:589–599. - PubMed

MeSH terms